Because mobile
observability shouldn't suck
Get real-world visibility into your mobile app. No release cycles, no extra wiring, no noise. Define what matters remotely, capture rich on-device logs, and surface the most important sessions for quick debugging.

Why bitdrift
Stop bugs from
becoming 1-star reviews
Catch issues before you ever get a complaint. From full blown app crashes to slow-loading screens, ANRs, out-of-memory errors, and more, illuminate the trickiest issues in real-time.More telemetry, lower cost
Leverage on-device storage and our patented ring buffer to capture unlimited data and store only the signals you care about.
Learn More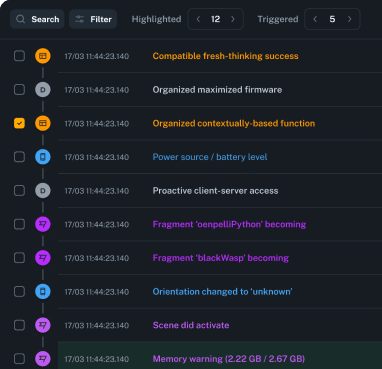
Crash data is just the start
Catch and fix crashes quickly, using the most relevant data. Plus, easily discover slow loading screens, ANRs, out-of-memory errors, and other non-fatals.
Learn More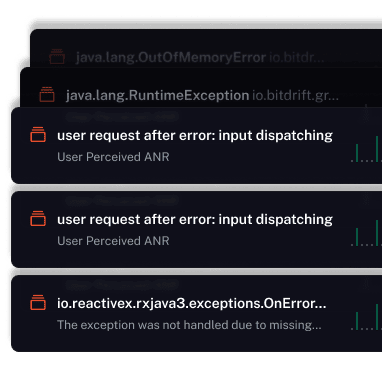
Uncover issues you never could before
Uncover issues you never knew existed and debug on the edge with full context - no log limits, no new syntax, and no app re-releases.
Learn More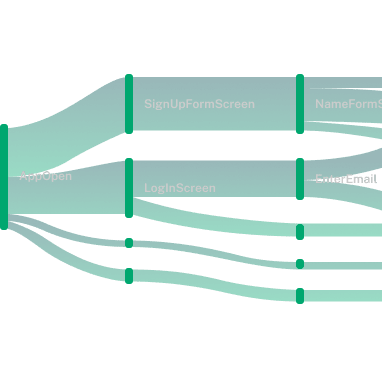

Deploy changes instantly. No app update required
Want to collect more data? Simply change or deploy a new workflow and watch the data roll in. No need to redeploy your app or wait on app store approval.
Learn More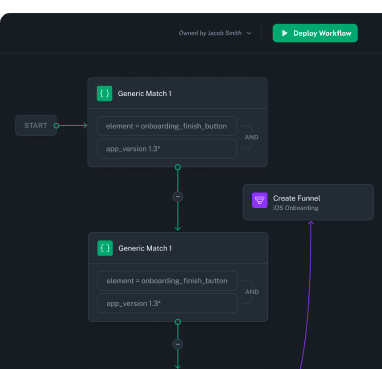
Resolve bugs faster with visual, context rich debugging
3D session replay, in-depth logs, synthetic metrics, and targeted filtering helps you solve issues faster with the right information.
Learn More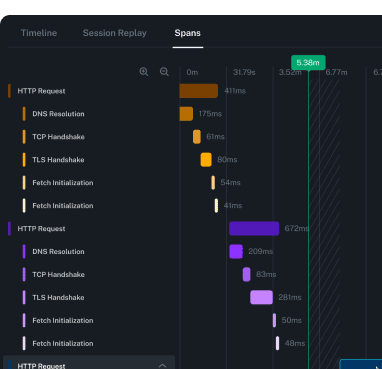
See what your users see in real time
See a moment-by-moment view of what happened around every issue, with privacy-conscious replays from the sessions that matter.
Learn More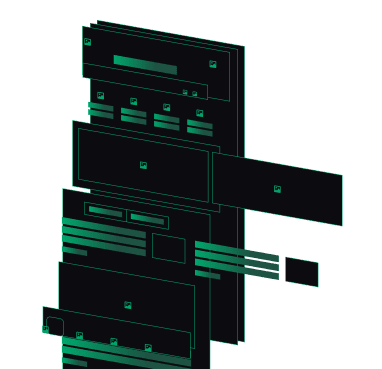
New Observability
Observability that's
custom-built for mobile
The way we build and deploy software has changed radically in the past decade, but most observability is still stuck in a traditional model that severely limits how developers debug and monitor their apps. Our approach is all about building and scaling better apps with unlimited telemetry, instantly deployed changes, and a cost model that doesn't break the bank.
DRAG TO COMPARE
TRADITIONAL

Doesn't impose cost constraints
Only pay for what's useful. bitdrift stores and analyzes just the data you need and not everything you collect.

Lets you log everything
No limits. Log everything from device events to network context if it might help one day, capture it now.
Builds intelligence into devices
Devices decide what to log and store in real time powered by a local Ring Buffer and smart logic at the edge.
Has instant feedback cycles
Make telemetry changes and deploy them instantly. No need to wait for releases or approvals.
Gives mobile the focus it deserves
Mobile devs finally get first-class observability on par with backend tools, purpose-built for app fleets.
Expensive & inefficient
Whether you pay for storage or per host, Old Observability costs a lot: well past 30% of most teams' entire infrastructure bill. That's because you pay for what you generate, instead of what you actually use.
Forces teams to log less
High costs make teams log only what's essential, leading to gaps in context when things break.
Assumes dumb devices
Old Observability treats devices as passive log shippers with no logic beyond basic filters or hardcoded telemetry.
Has slow feedback cycles
Lack of context forces teams to add logs after issues occur, delaying fixes until the next deployment and new data collection.
Ignores mobile
Old Observability leaves mobile behind. Devs rely on patchwork tools and only hear about bugs when users report them.


Log everything, but only
send what you really need
Most solutions start streaming data to expensive backend observability pipelines on install. Instead, we believe you shouldn't be limited by log limits and hefty overage fees. We use a local storage ring buffer combined with our control plane to give you maximum control over the data you need, anytime you need it.
How it works
01
Install the bitdrift SDK
Integrate our lightweight SDK into your app to capture rich telemetry with minimal overhead. Available for Android, iOS, React Native, and Electron. Start the logger with your API key to begin collecting data.
Learn More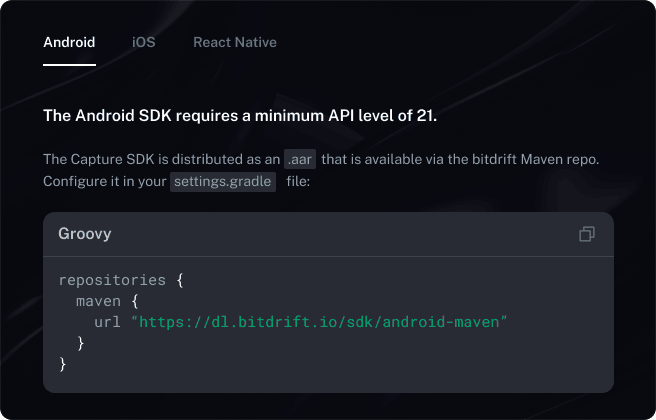
02
Deploy a workflow
Set up targeted workflows to monitor specific events or behaviors. Workflows enable real-time data collection and visualization, allowing you to focus on what matters most.
Learn More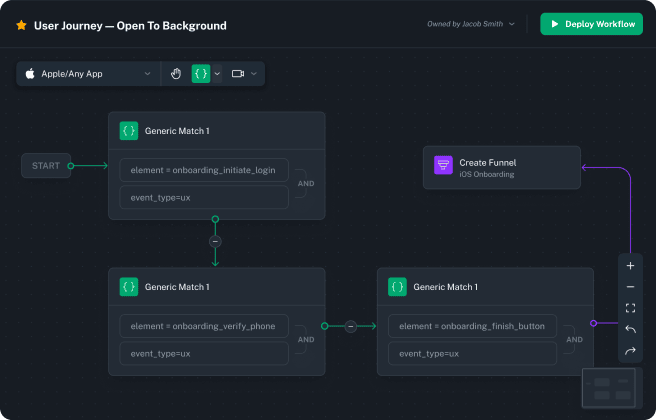
03
Review important alerts
Get notified when unexpected behavior occurs. Quickly catch crashes and non-fatal errors, review relevant sessions, and work towards a solution quickly.
Learn More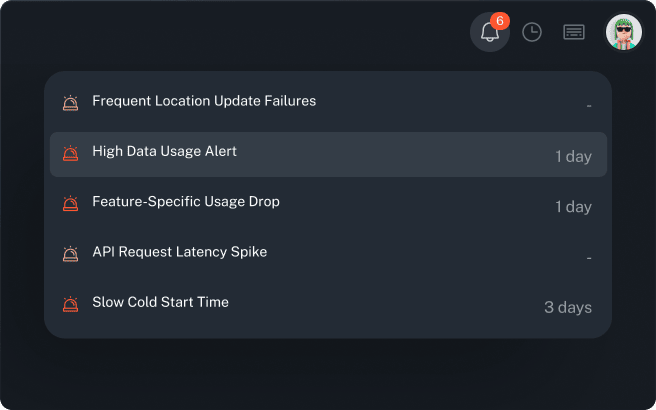
04
Investigate events in the timeline
Use the timeline to replay sessions and debug with logs, network data, app state changes, and crash reports.
Learn More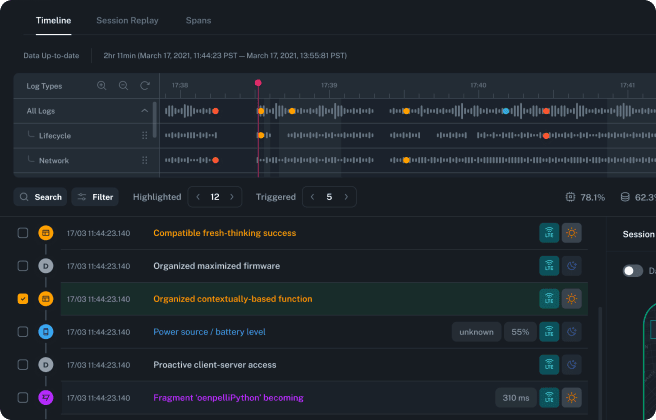
05
Explore Instant Insights
Access Instant Insights to view automatically generated dashboards showcasing app health, user experience, resource usage, and network performance. These charts help you quickly identify trends and anomalies.
Learn More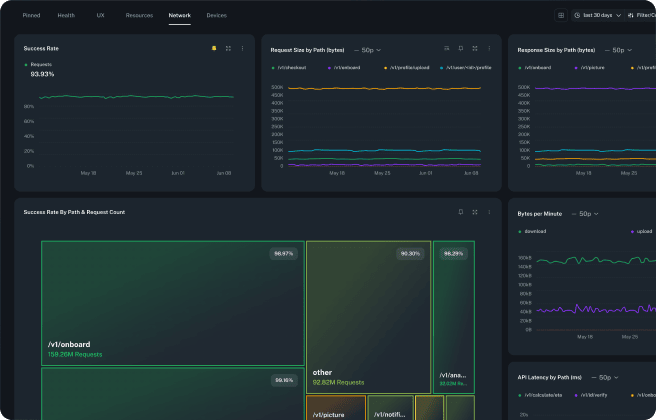
Testimonials
What our customers love about us

Patrick Sunday
Director of Infrastructure, Lyft
Since integrating bitdrift into our open beta program, we've dramatically improved how quickly we resolve issues before they reach millions of users. Ship-blocking defects that once took days or weeks are now fixed in hours, thanks to deeper insight into root causes. It's reduced time-to-learn from production in a practical way.

Laurie Darcey
Mobile Platforms, Reddit
Capture transformed our development process, boosting efficiency and customer experience. Bug resolution is faster than ever, and app stability has noticeably improved. It's more than a tool, it's a game-changer for mobile teams.

Paul Frazee
CTO, Bluesky
bitdrift makes debugging faster. One engineer fixed a long-standing bug in 30 seconds using a query that reproduced the issue in production. We now spend less time chasing bugs and more time shipping features.

David Bolcsfoldi
Director, System Software
With bitdrift, we can capture new telemetry across millions of devices without a single redeploy, giving our teams real-time visibility to debug issues as they happen. Its flexible approach has quickly made it an indispensable part of our observability stack.

Igor Korobka
Staff Engineer, FavorDelivery
I think bitdrift is one of those rare products where people have needed it desperately, they just didn't know it. It makes a previously very expensive and hard to obtain context available to almost anyone, which will propel the entire industry to new heights and new levels of quality.

Anny Walker
Senior Mobile Engineer, MileIQ
In bitdrift, we can get device signals like battery usage and network performance - things that we are not actively putting somewhere in code. We get it just because we integrated the bitdrift SDK.

Andy George
Senior Product Manager, iCabbi
I was not very aware of what mobile observability needed to do or why we needed it... now [thanks to bitdrift] it's really front and center.

Drew Heavner
Staff Engineer, Reddit
bitdrift helps us detect and resolve client defects without needing new deployments.It's been crucial in keeping weekly mobile releases on track and maintaining a stable, smooth production environment.

Daniel Kaparunakis
Staff Engineer, FavorDelivery
Using workflows is significantly easier than having to learn a very specific query language that works on one specific tool. I can easily tell my engineers,'hey, here's how you use the tool.' Then boom.
Enterprise Ready
Safeguard credentials, content, and storage

BYOB
Keep strict control over your sensitive data on your own blog storage while bitdrift runs the rest of the system as a full SaaS.

SOC 2
bitdrift has partnered with Assurance Lab to achieve the SOC 2 type I compliance certification. Customers can now rest easy that their telemetry data is in good hands and governed by audited industry best practices.

Performance-centric
Our SDK is built for high-performance, low-overhead observability, giving you unmatched visibility without affecting user experience
Ready to get started?
Start your trial!
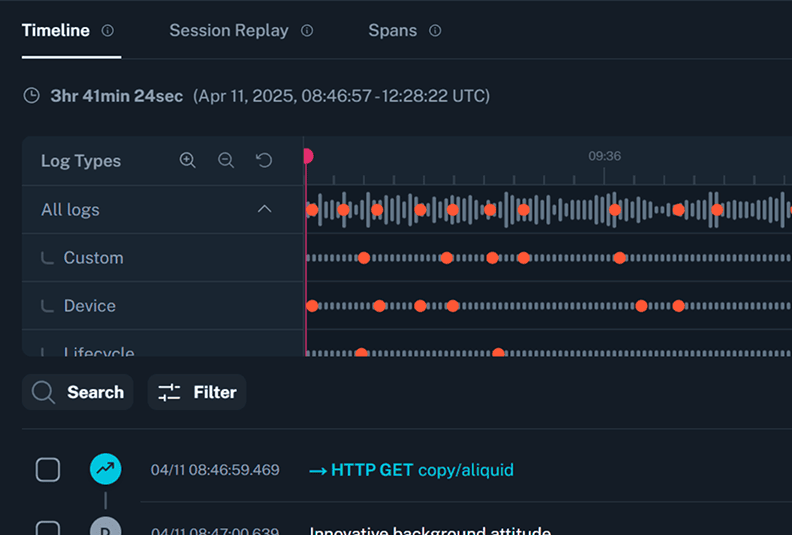

Quick tour of bitdrift Capture
Peter Morelli, CEO at bitdrift