removed
Legacy migration tools removed
Migration controls for legacy Explorations and Reports have been removed after the announced transition window. Workflow Views and Custom Dashboards remain available for organizing workflows and charts.
Keep up to date with the latest changes from bitdrift. You can find all the SDK updates in our docs: Android, iOS, React Native
Migration controls for legacy Explorations and Reports have been removed after the announced transition window. Workflow Views and Custom Dashboards remain available for organizing workflows and charts.
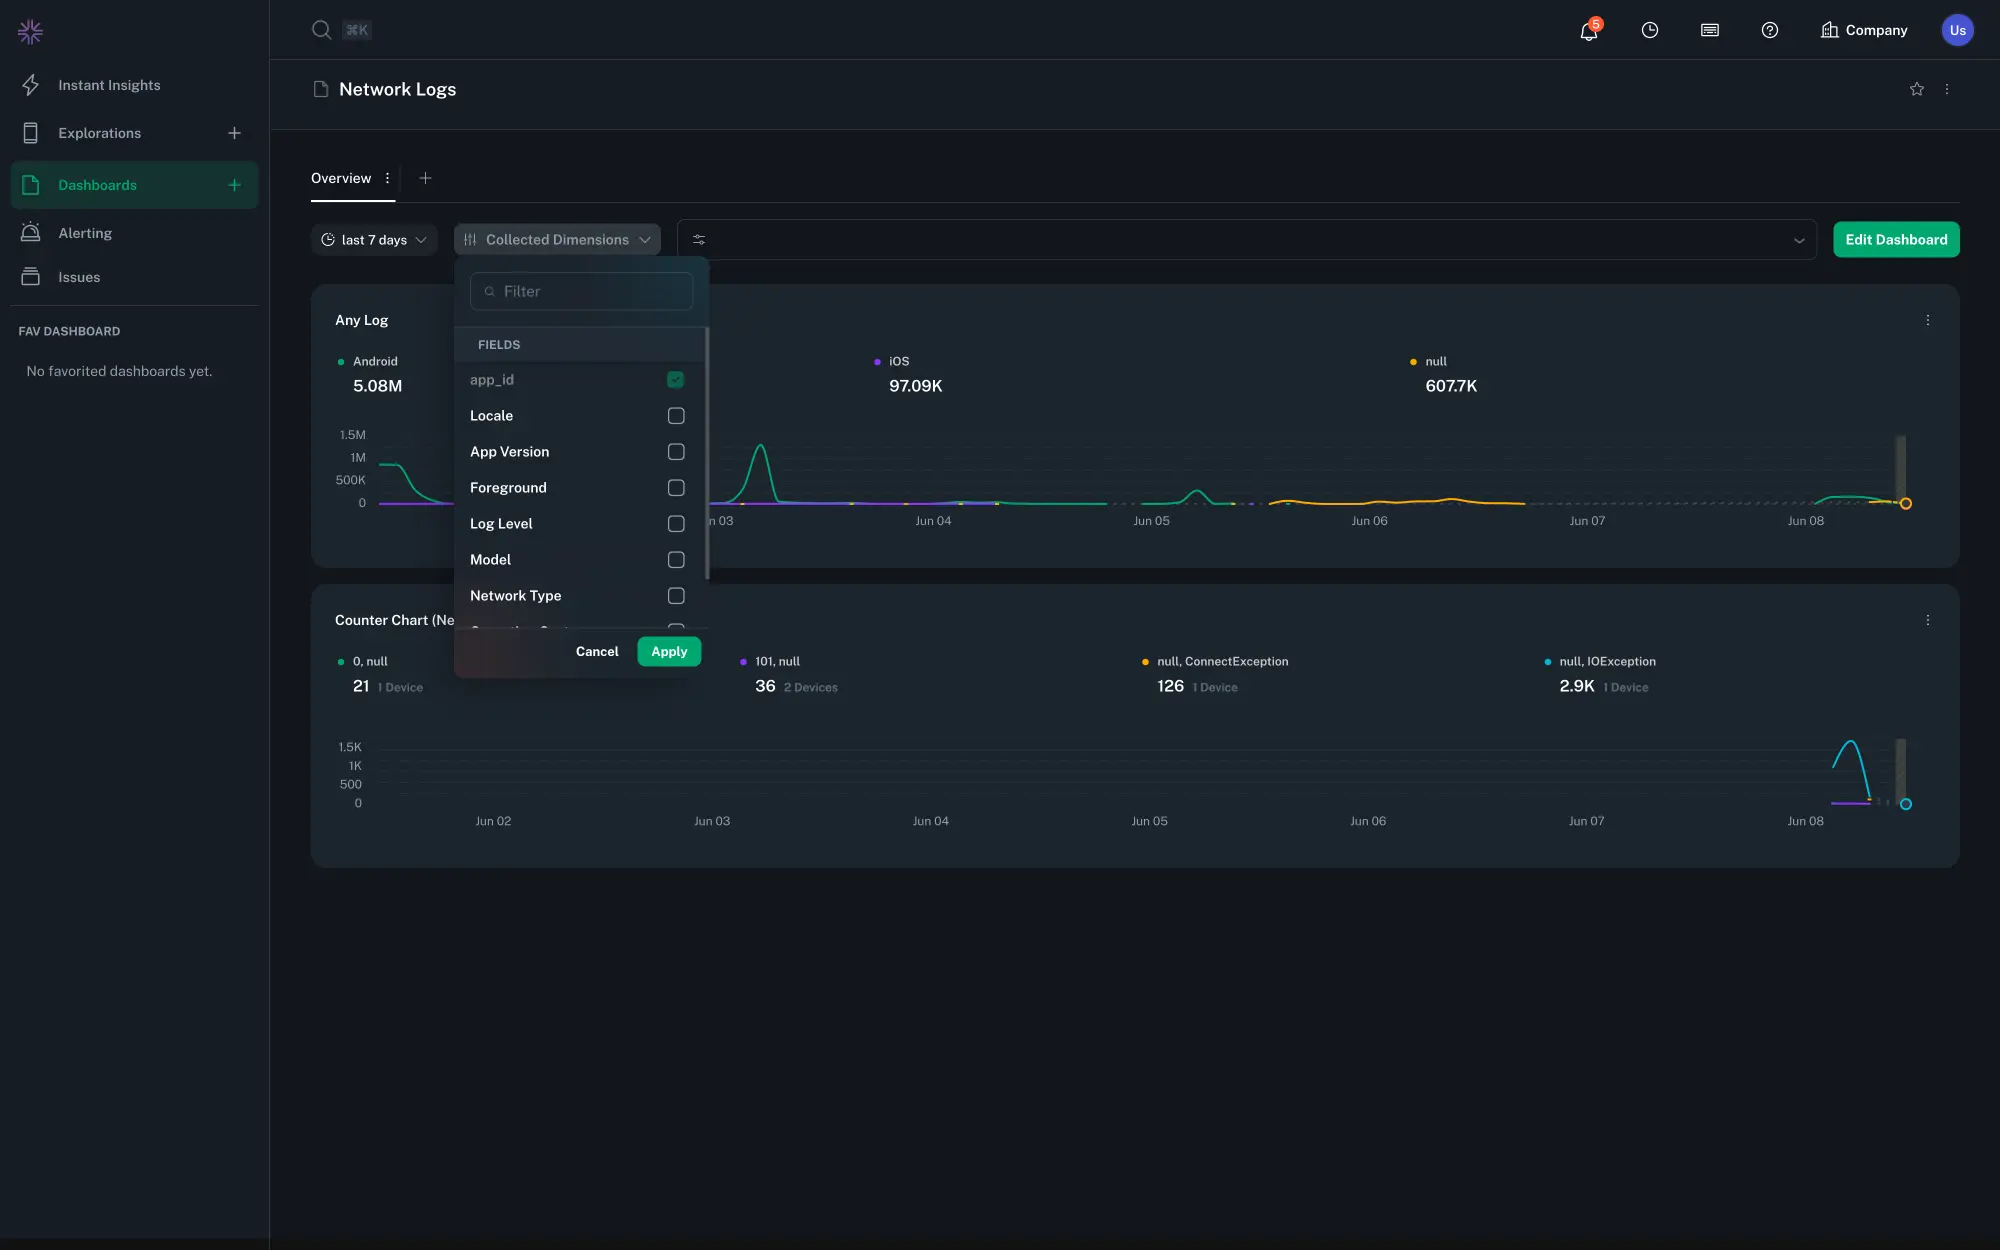
Custom dashboard filters now suggest known app IDs for faster, more accurate filtering, while still allowing custom entries.
Fixed a bug which resulted in deep links to workflow output charts being broken.
You can now filter issue groups and issue lists by their Details field, including multi-value include and exclude searches.
Issue lists and issue details now show the status of an associated session, so you can tell whether its timeline, replay, or spans are available before opening it.
Charts now render their primary data before unique-device counts finish calculating, then show those counts when ready.
Fixed a bug which caused auto-scroll to overshoot the target log
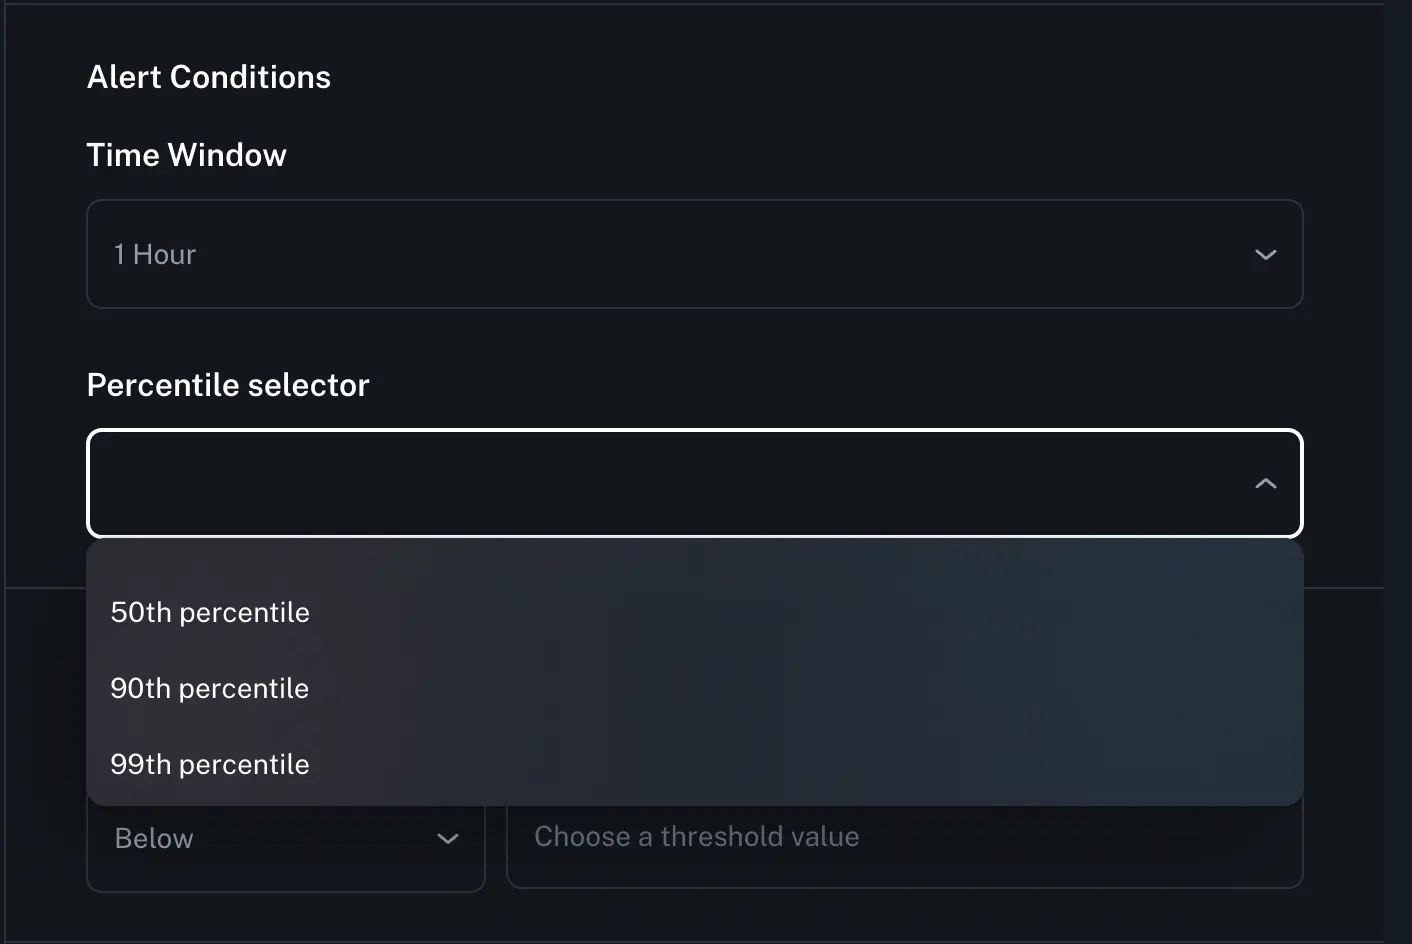
Fixed percentile handling across workflow charts, chart previews, and custom dashboards so saved or backend-defined percentile settings stay available and behave more consistently as you navigate and compare results.
Explorations have been deprecated in favor of Workflow Views. Legacy explorations can be migrated to Workflow Views for the next two weeks.
Selected percentiles are now saved with workflow and custom dashboard chart settings, so your choices persist without relying on the page URL and remain consistent when charts are reopened or shared.
You can now sort chart table rows by any column in ascending or descending order. CSV exports follow the active sort order.
The web app update notification now uses a clearly labeled Dismiss action, making it easier to close without refreshing.
Custom dashboards now scroll automatically when you drag an element near the top or bottom of the page, making it easier to move content across long layouts.
Fixed iOS app versions in issue lists and details so they show both the app version and build number instead of displaying only the build number.
Fixed issue filters with multiple values so each value can support wild card characters, producing the expected results.
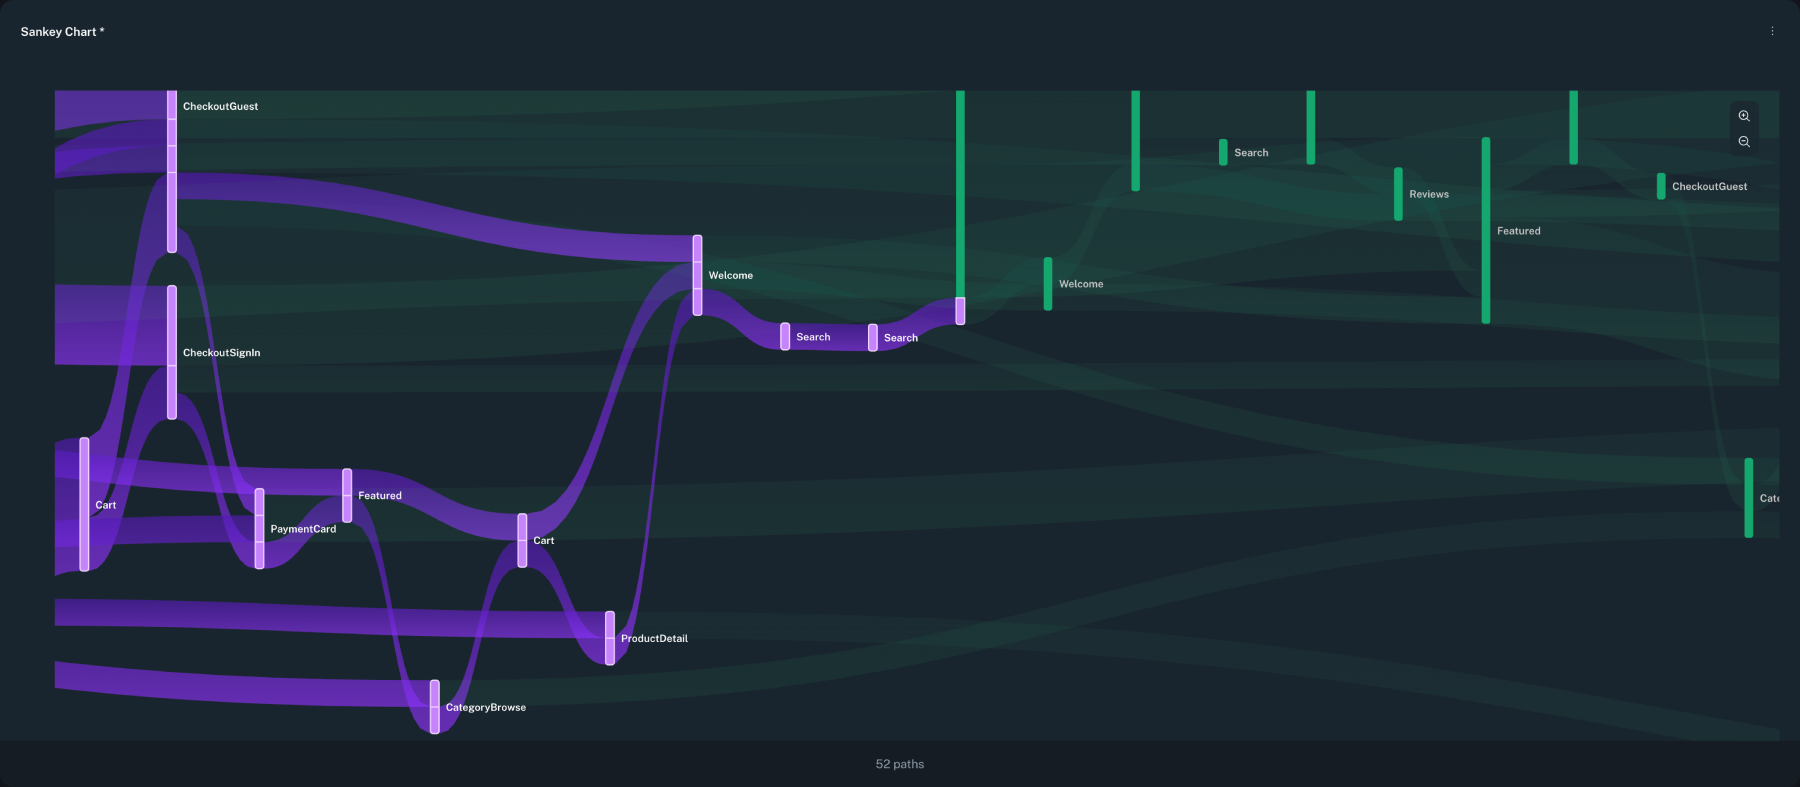
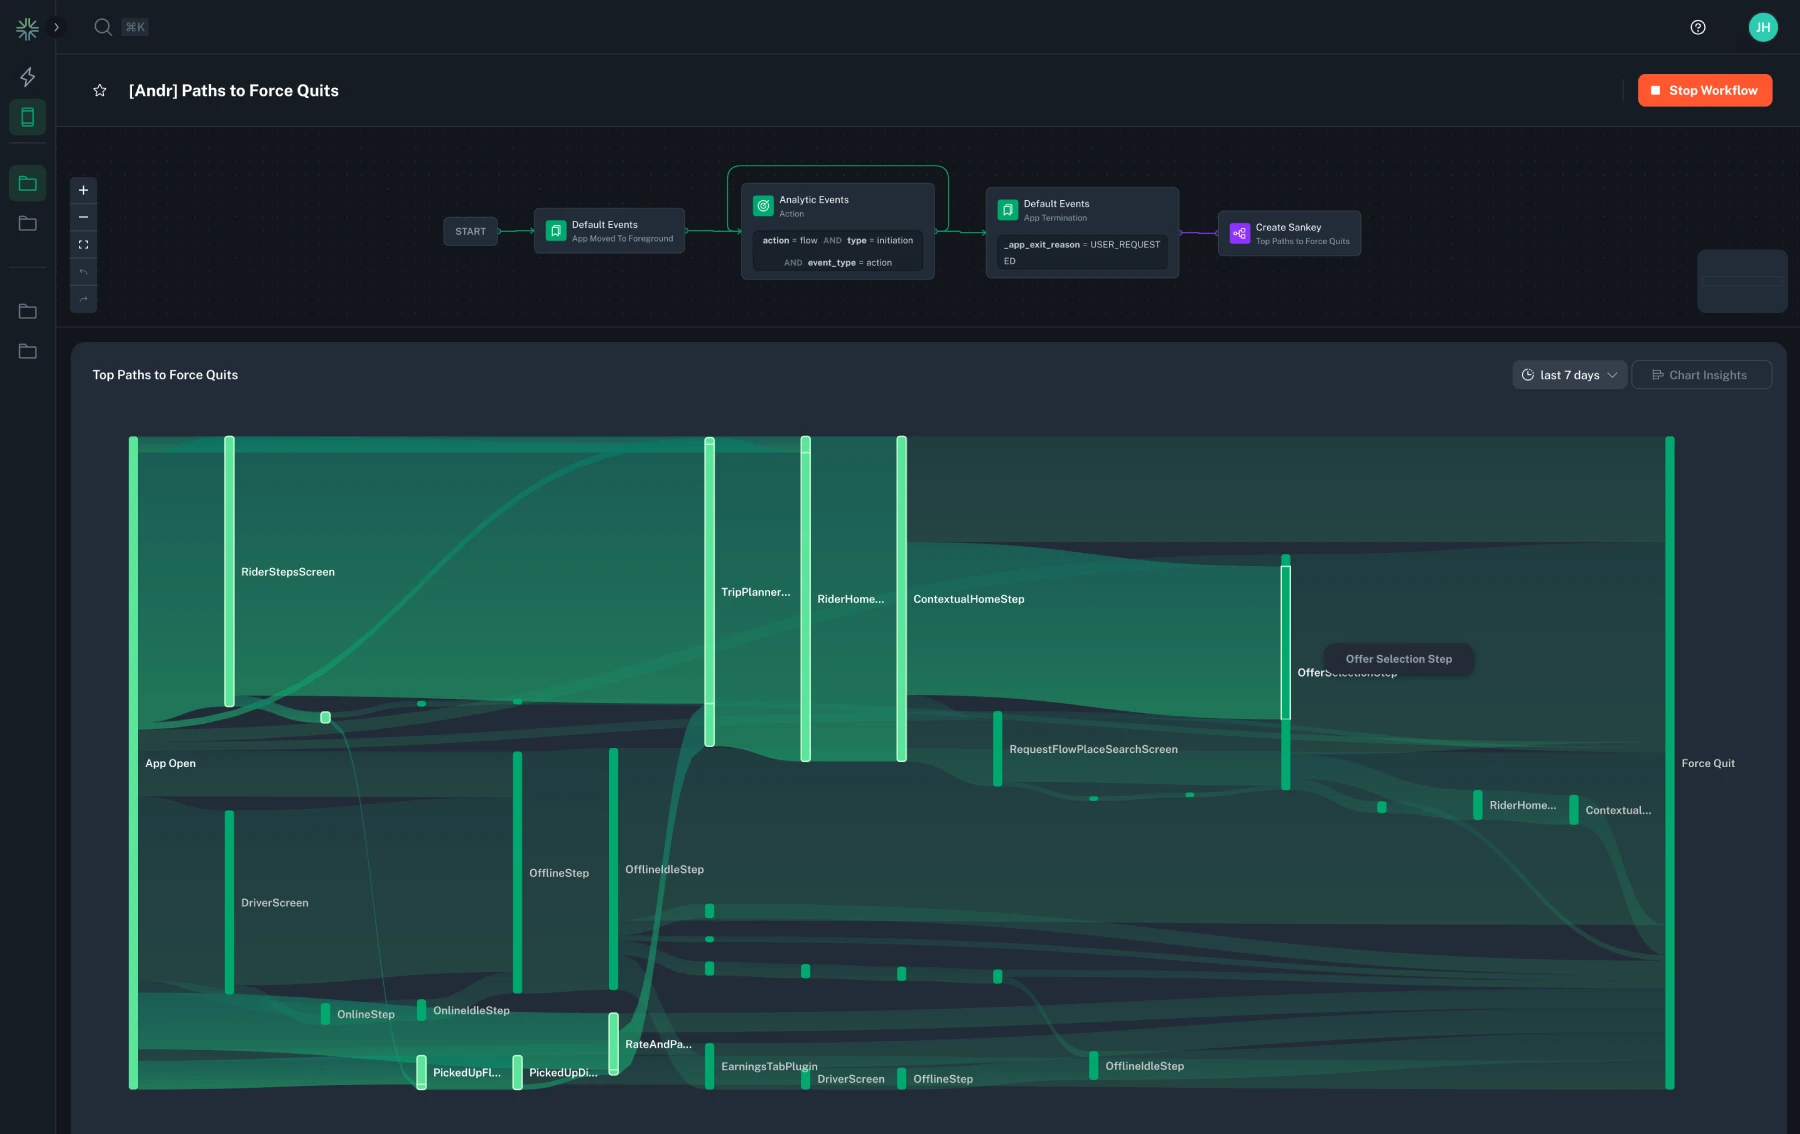
You can now pin Sankey paths for persistent highlighting, spread dense paths with zoom controls, and pan across the expanded chart to investigate complex flows more easily.
You can now create a workflow directly from the Workflow Views page or from the command palette, with the new workflow opening immediately for editing.
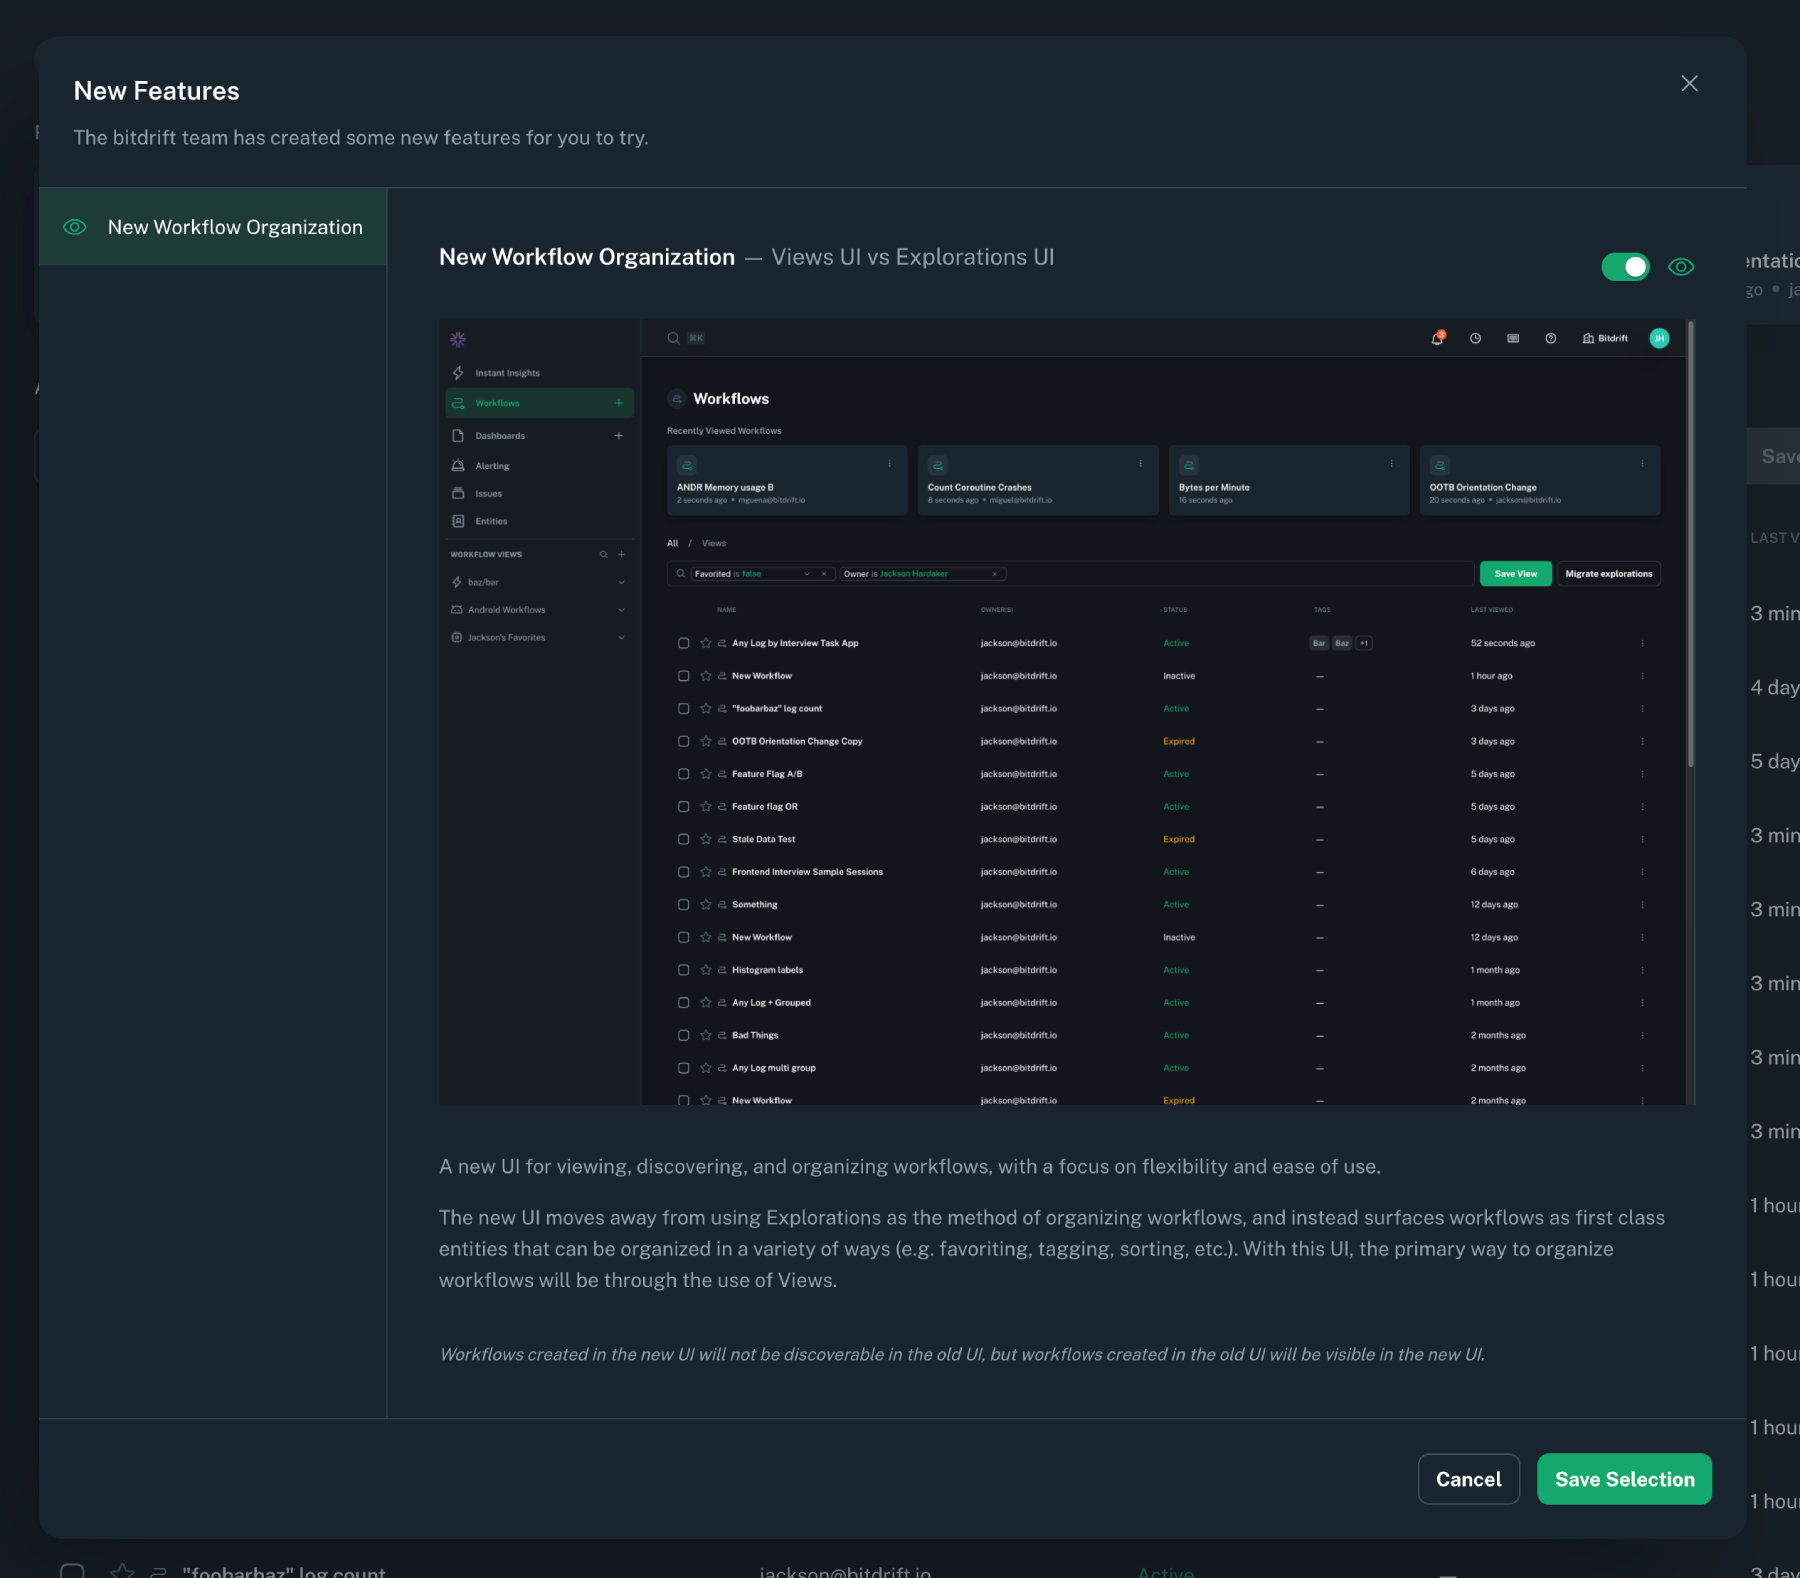
Workflow Views is now the default experience for viewing and organizing workflows. If you previously used the preview toggle, you can still switch back from Feature Previews in the user menu.
Fixed a bug where changing a workflow's target platform could leave platform-specific conditions on nodes like SDK Started and Network Request set to the previous platform, preventing those workflows from matching correctly.
Custom dashboard charts now include an expand control so you can inspect a single chart in a larger focused view, and direct links to individual charts now resolve correctly when you open or share them.
Fixed percentile selection in custom dashboards and alert configuration so backend-defined or previously saved percentile values remain available and continue to work correctly.
Chart legends now keep series colors more consistent across reorderings and larger sets of series, reducing unexpected color changes while you compare results.
Fixed the issue assignee selector so unassigned items render more clearly without showing an empty secondary line.
Fixed a bug which caused the platform selector to show a stale value when switching between workflows.
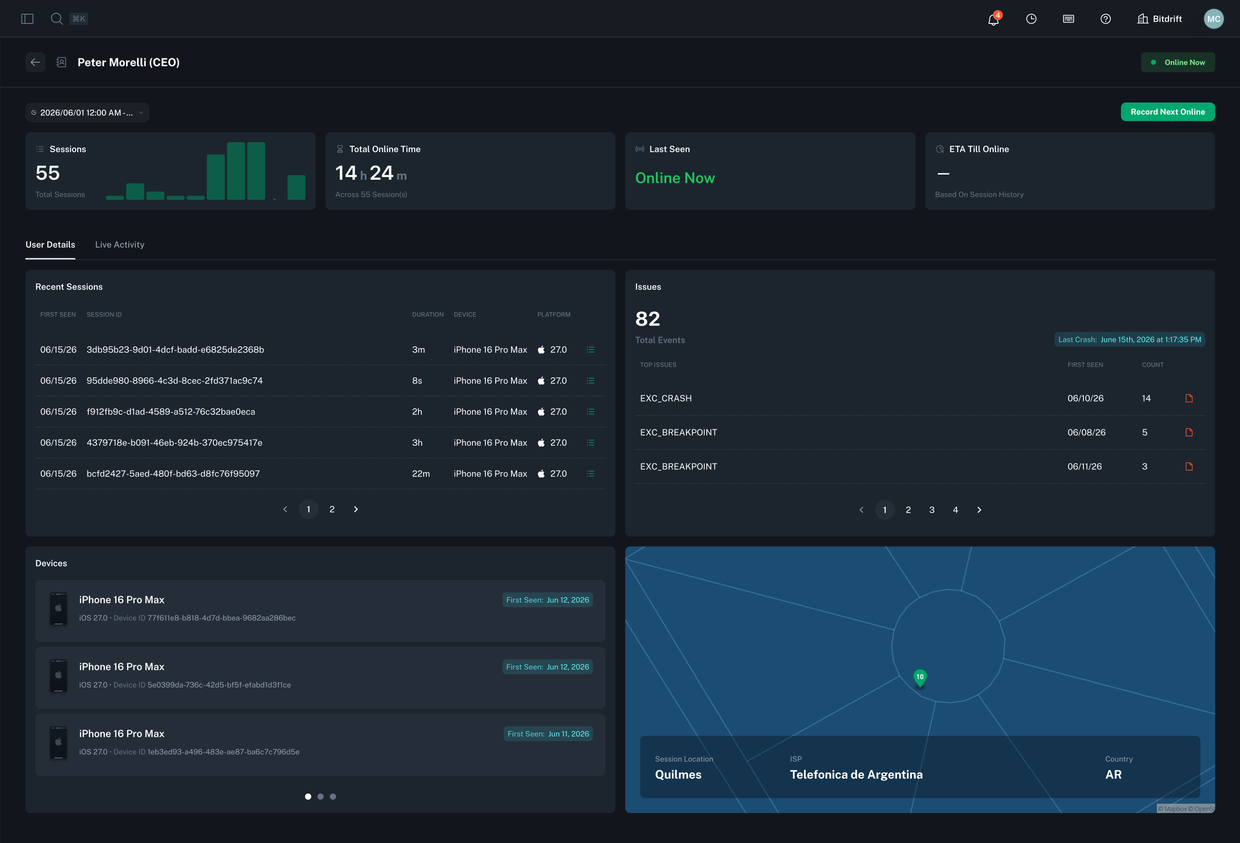
Introducing Entities, a new way to bring bitdrift Capture's real-time debugging and observability to individual end-users. Support and engineering teams can now investigate a specific user or device, understand what happened, and capture the right context without waiting for a new app release or over-collecting telemetry across the entire population.
Clicking a line chart legend item now selects that series instead of hiding it, and you can keep multiple selected series visible for comparison.
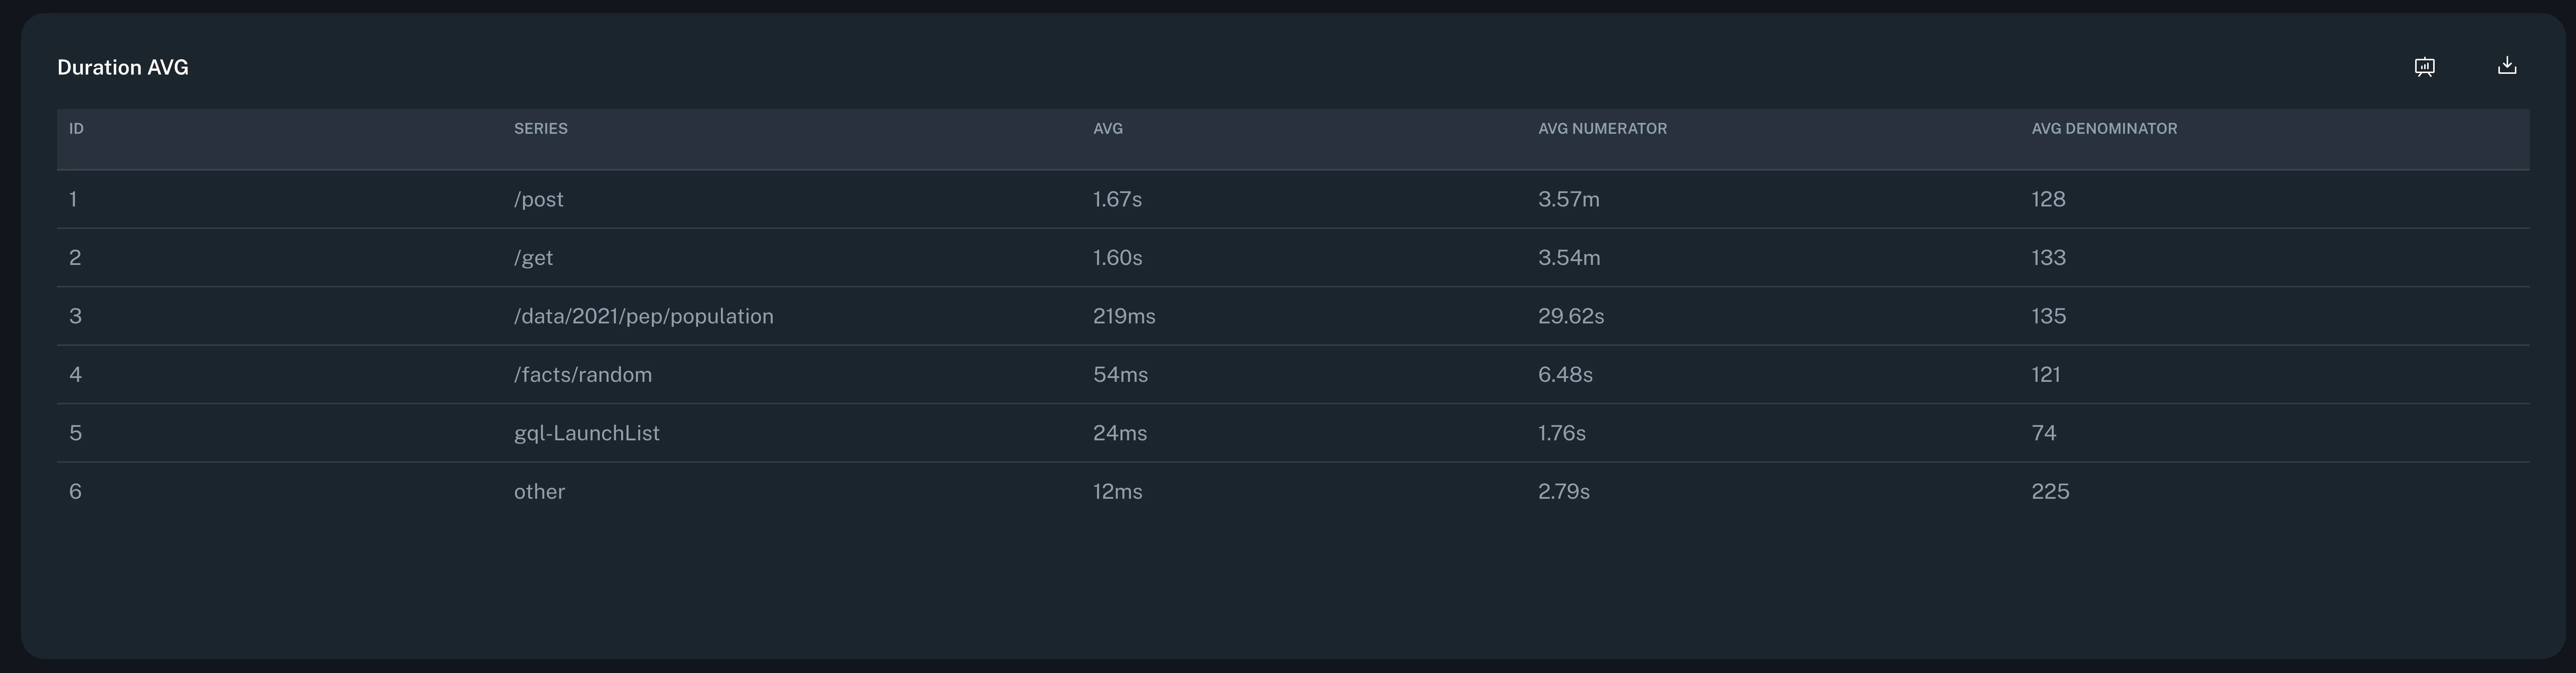
Fixed a bug which prevented the table view of an Average Chart from displaying grouped dimension labels.
Fixed a bug which resulted in the primary stat in an Average Chart legend displaying 0 at all times.
Introducing a new 'Workflow Views' UI, providing an enhanced interface for managing and interacting with workflows. This feature can be previewed via the new Feature Previews of the user menu.
You can now build custom dashboards from workflow-backed charts, organize them with tabs, headings, text, and dividers, and filter them with shared dashboard dimensions. You can migrate your existing Exploration Reports easily to preserve your existing data.
Fixed a bug after duplicating a workflow, updates to that copied workflow do not correctly refresh the recorded session output.
Fixed a bug where the y-axis was calculated incorrectly during chart comparisons in Instant Insights.
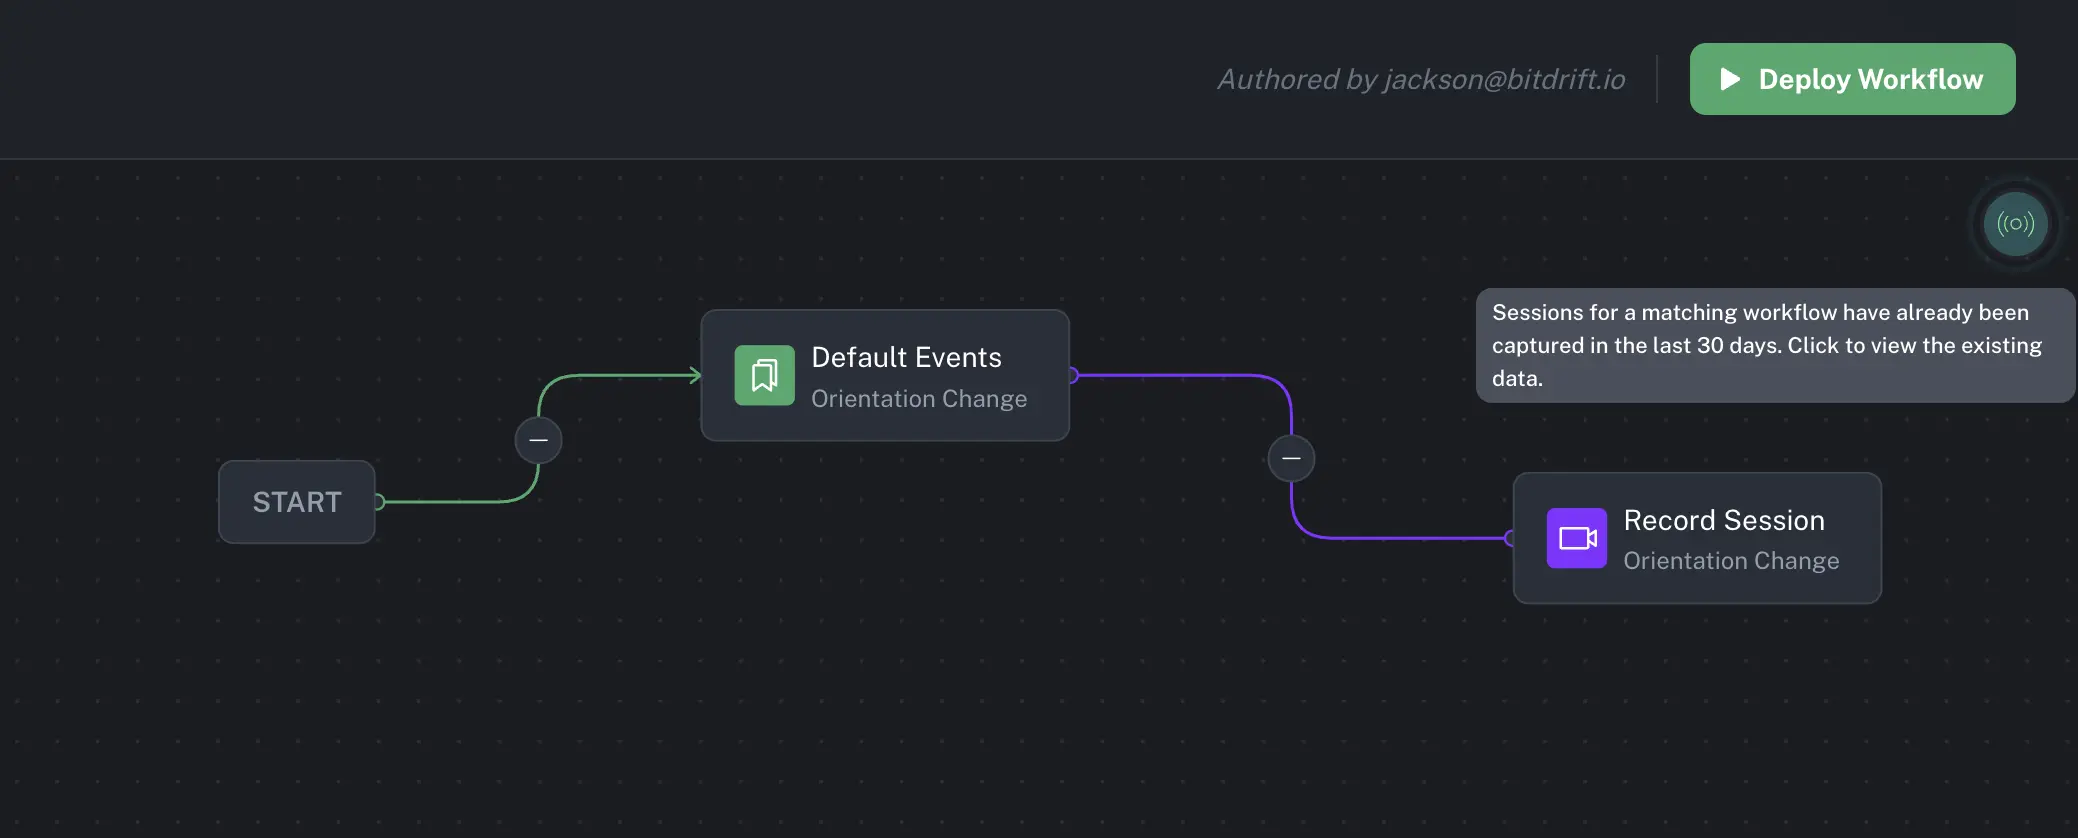
Removed the ability to view captured sessions for deactivated workflows, when data matching the workflow already exists. To view captured sessions for a workflow, it must now be deployed.
Fixed a bug where after deleting a workflow, the page would not redirect correctly.
Fixed a bug preventing workflows from being moved.
Fixed a bug preventing 'share links' to the issues page from including selected platforms and date ranges.
You can now copy and share links for filtered issue views, and add custom attributes directly on issue groups to track external ticket references and other metadata.
Fixed an issue where the issue views sidebar could request an excessive alert count, which could cause inaccurate or unstable alert indicator behavior.
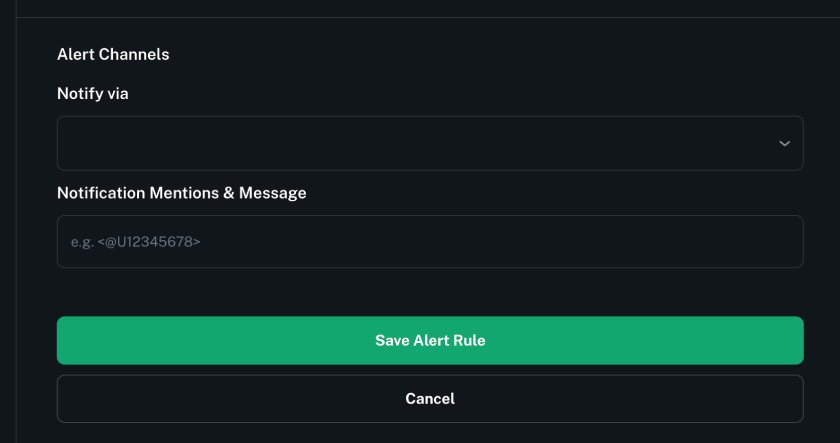
You can now add key-value notification tags when creating or editing alerts, making it easier to organize and route notifications across supported channels.
Fixed a bug preventing the creation of new issue views. You can now create and save a new issue view directly from the Issues page using your current filters and sorting, then open it immediately for ongoing monitoring and alerts.
Fixed a bug preventing search functionality from working on the Members page in company settings.
Fixed a bug where buttons inside data grid rows could overflow outside the visible grid area at narrow widths.
Line charts now visually distinguish the current, still-collecting aggregation window with a striped background, an open-circle marker, and a dashed connector line so you can tell at a glance which data points are not yet final.
Fixed a bug where line charts data could shift unexpectedly when no new data had arrived.
Fixed a bug where the legend tooltip on line charts could get stuck in an open state.
You can now drag across histogram bar charts to zoom into a bucket range more reliably, with smoother interaction whether the gesture starts on the plot background or directly on a bar. Tooltip behavior has also been improved so hover details stay clearer and less distracting while you drag.
Fixed an issue where the time axis on line charts could display an incorrect range when data timestamps were missing or partially defined.
Fixed a visual glitch where scrolling through stacktrace frames on the issue details page or timeline crash log could appear jittery and unpredictable.
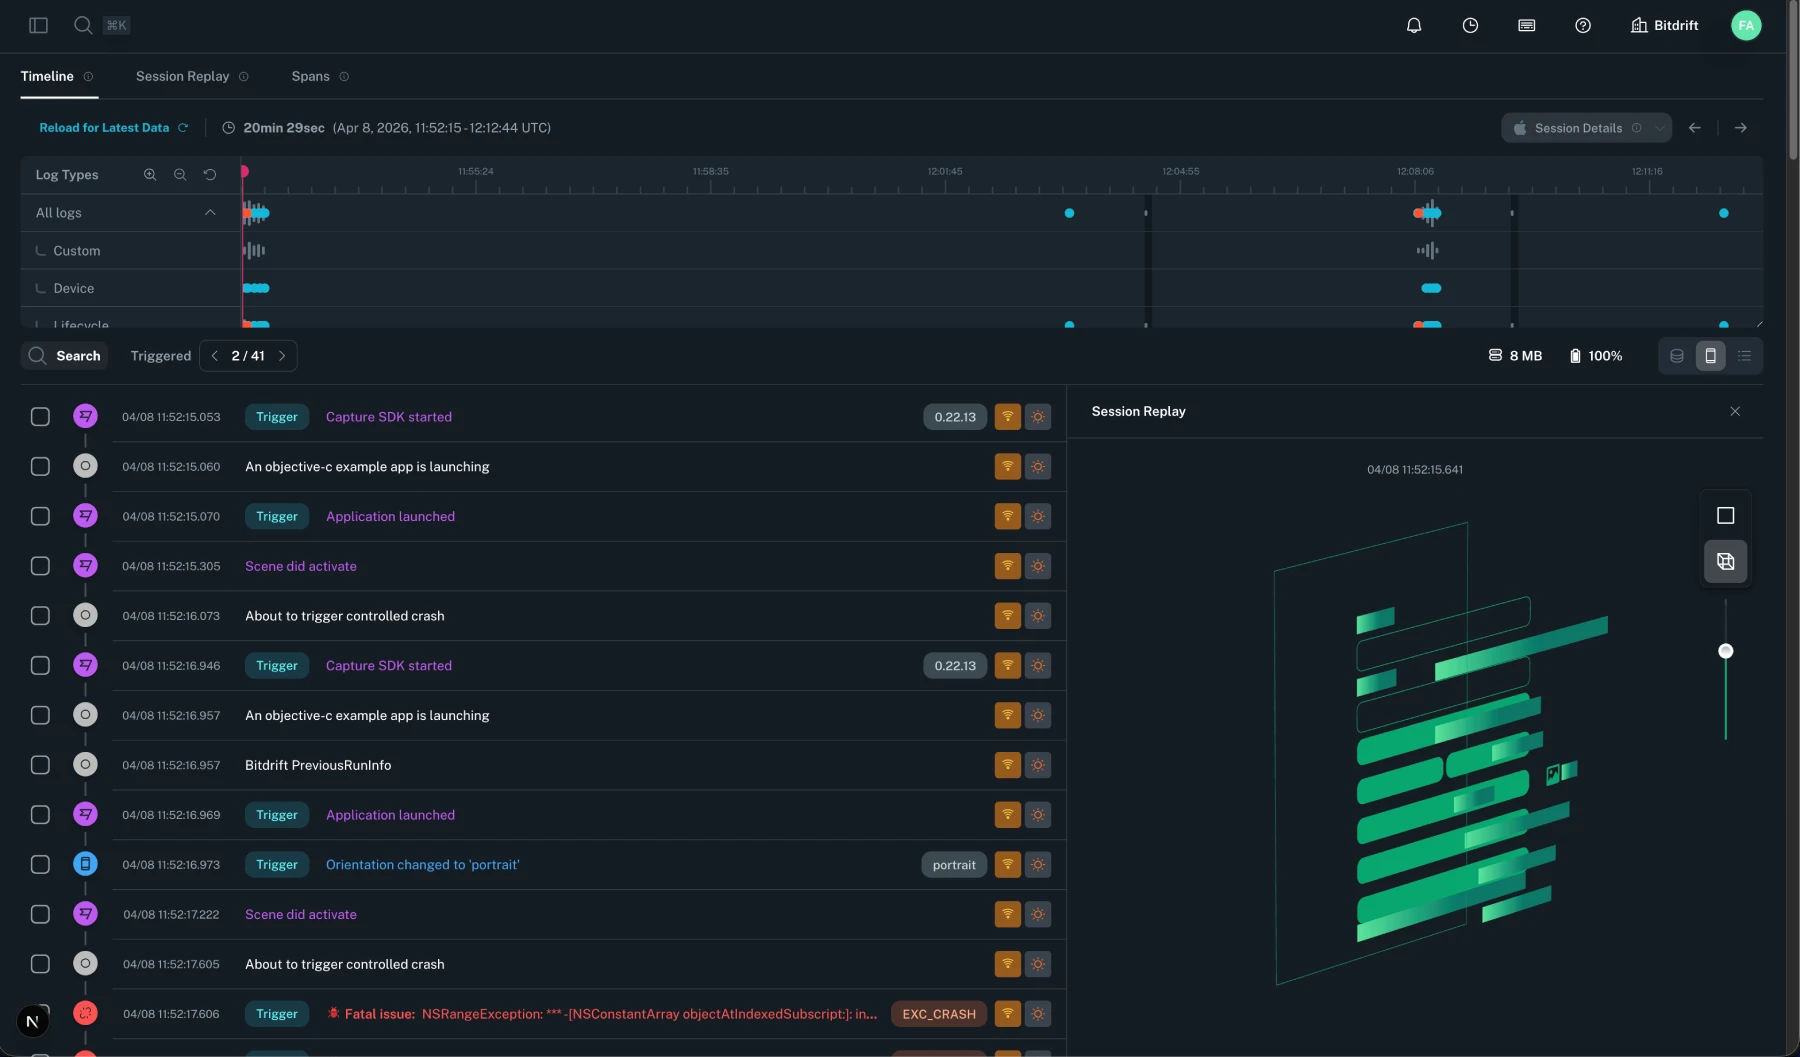
You can now adjust layer spacing in 3D Session Replay using a vertical slider in both the timeline panel and focus mode, giving you better depth control when inspecting stacked UI elements.
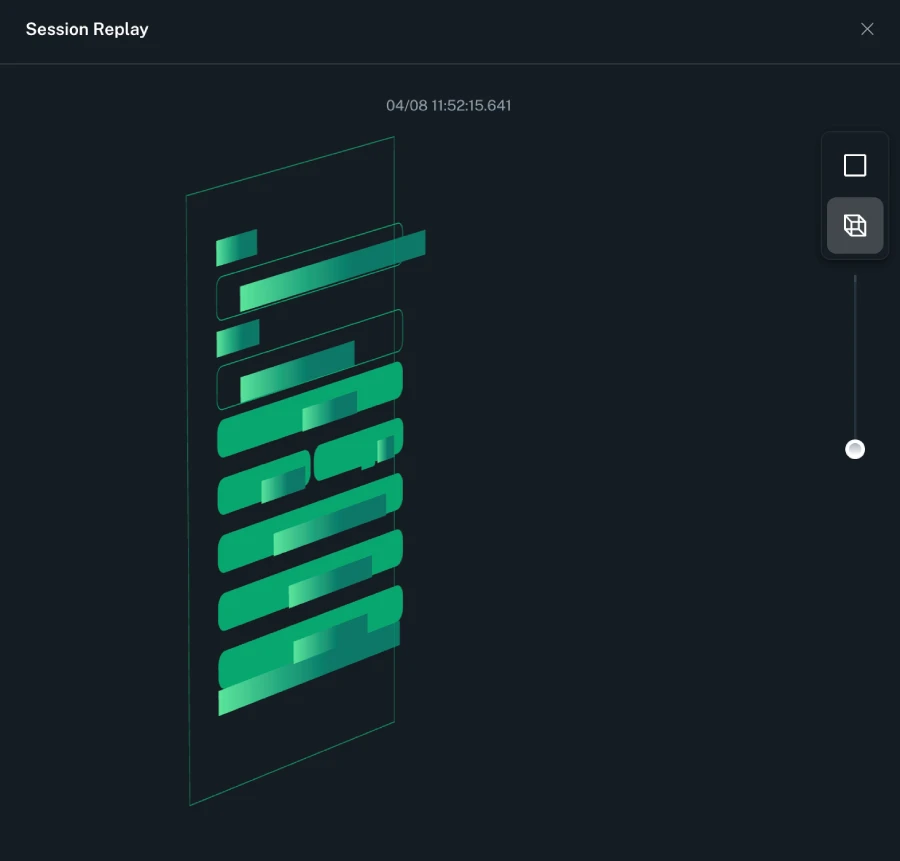
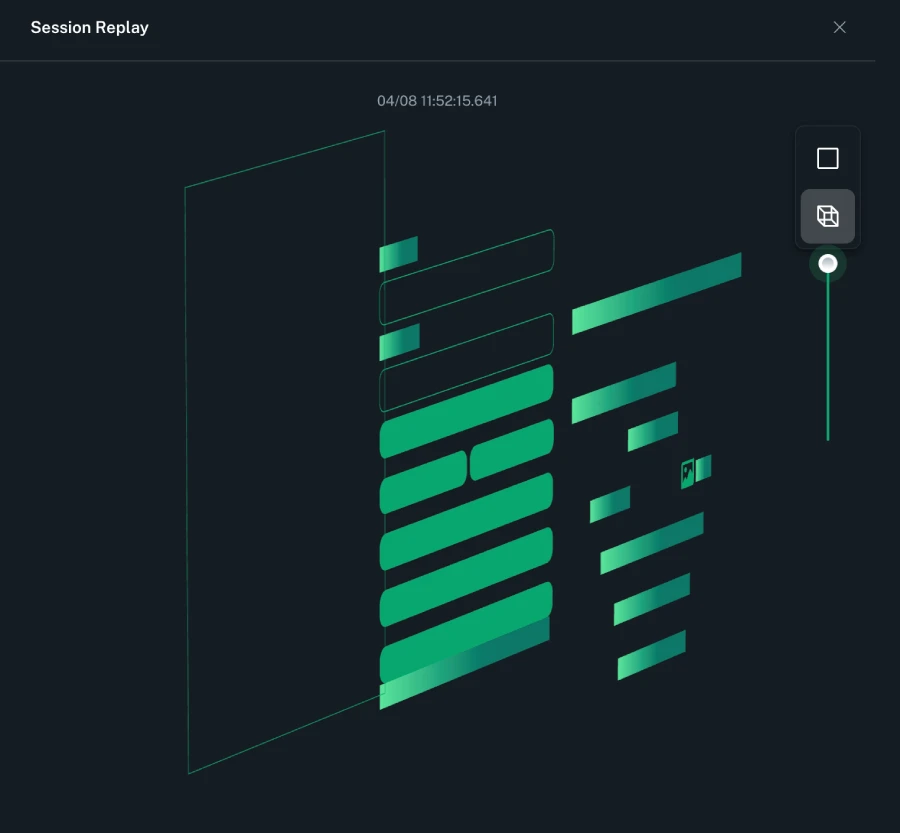
The Session Replay panel now includes a 2D/3D view toggle so you can switch between screenshot and 3D replay perspectives directly from the panel.
Fixed a bug where navigating to a workflow's timeline could fail to show the trigger rows correctly.
Fixed a bug where a workflow with a greater than 100 limit on daily sessions captured would show No Captured Sessions Found.
Changed how replay frames enforce minimum aspect ratio, which sometimes caused unrealistic screen dimensions for some devices. Replays now preserve the source screen proportions for more accurate visual context.
You can now drag-select a time range on charts in either direction — left-to-right or right-to-left — and the selection will be applied correctly.
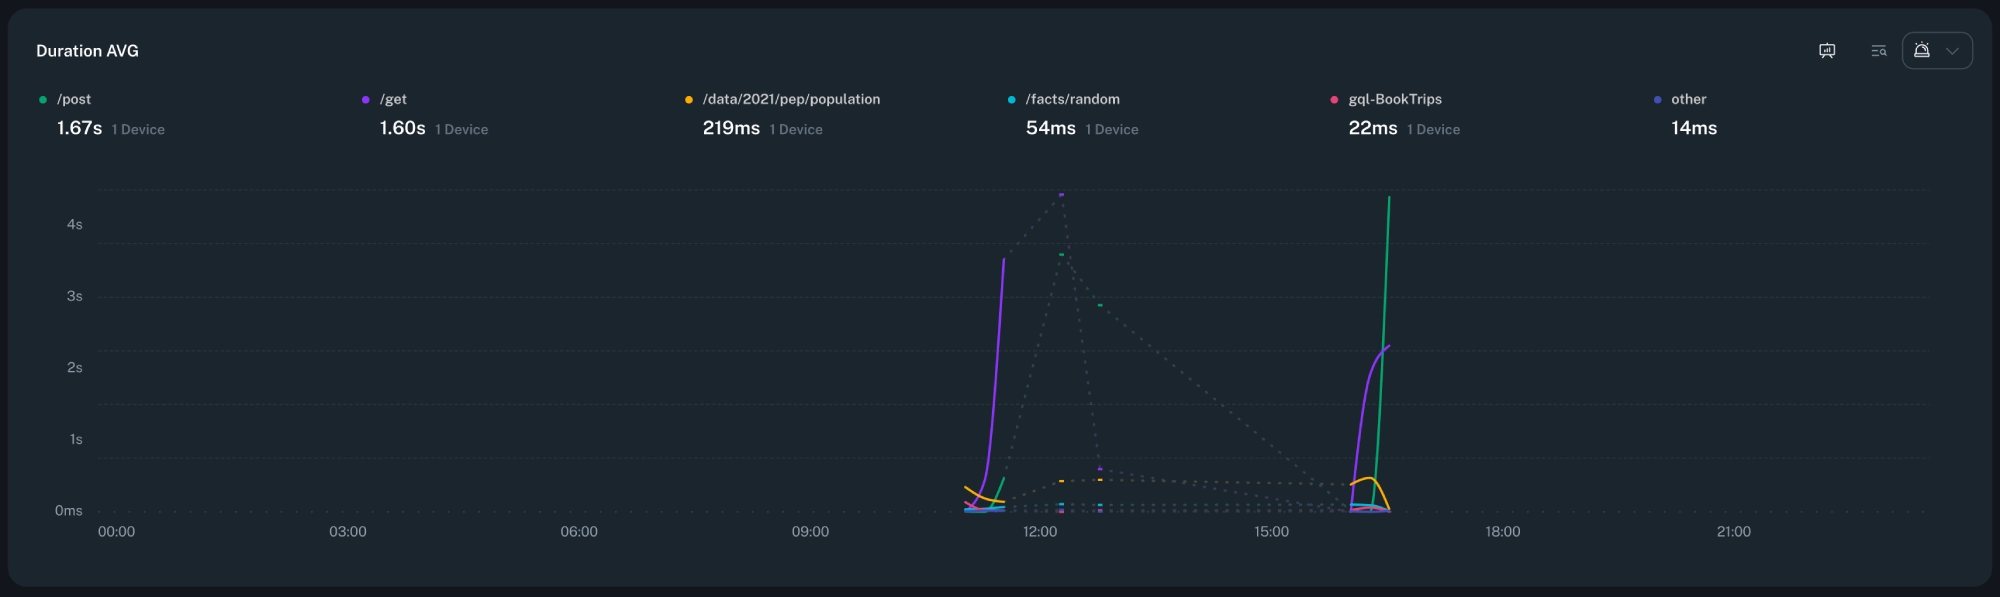
You can now configure Top K settings for line charts directly from the advanced chart menu. Choose the algorithm (Average, 2-Level, or 3-Level), set the sort order (Highest values first or Lowest values first), and control the number of series shown.
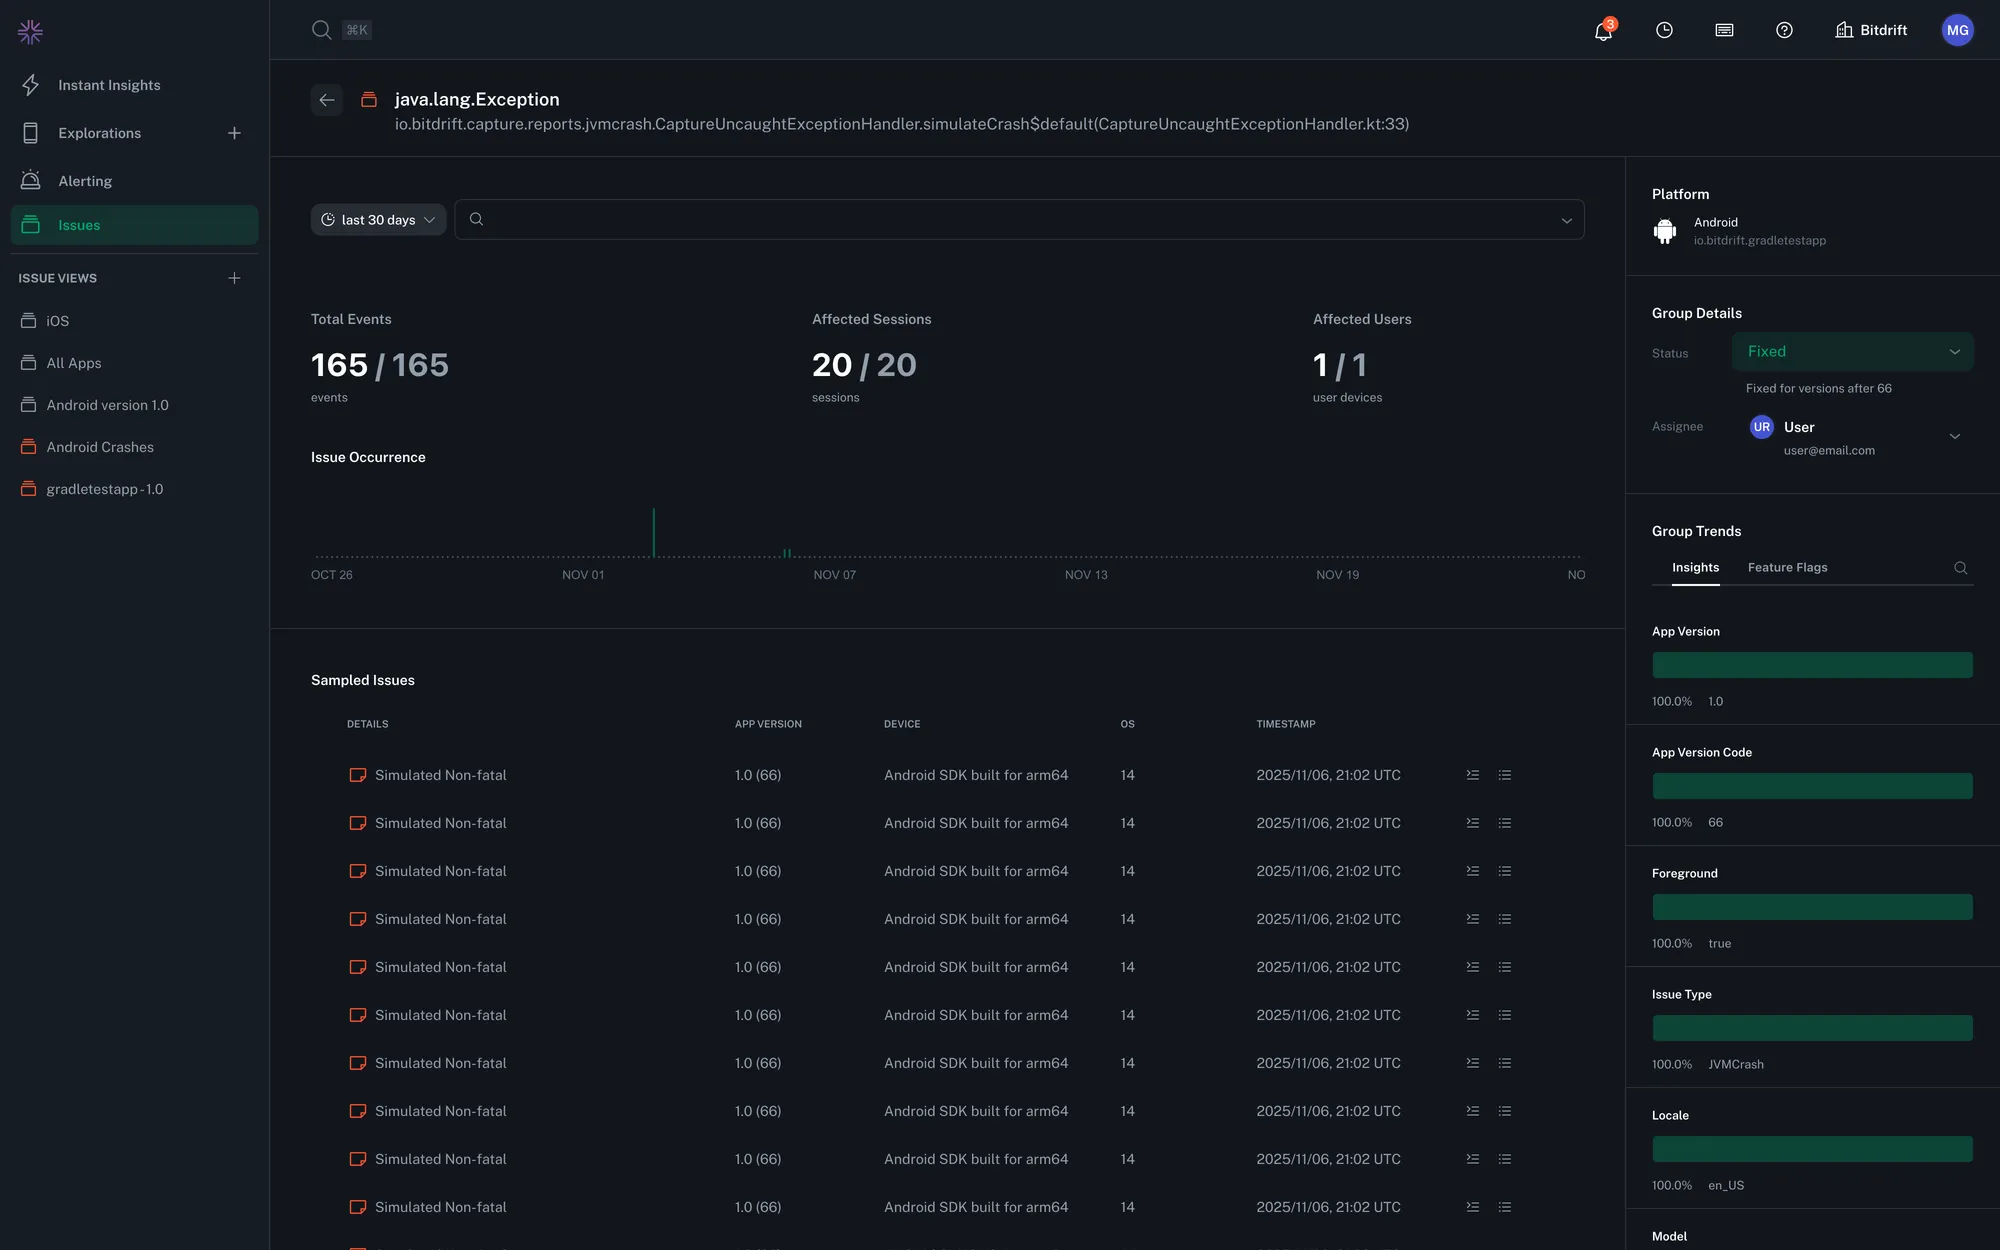
The Issues landing page now displays a total event count alongside the issue list, giving you a quick summary of the overall event volume for the selected time range.
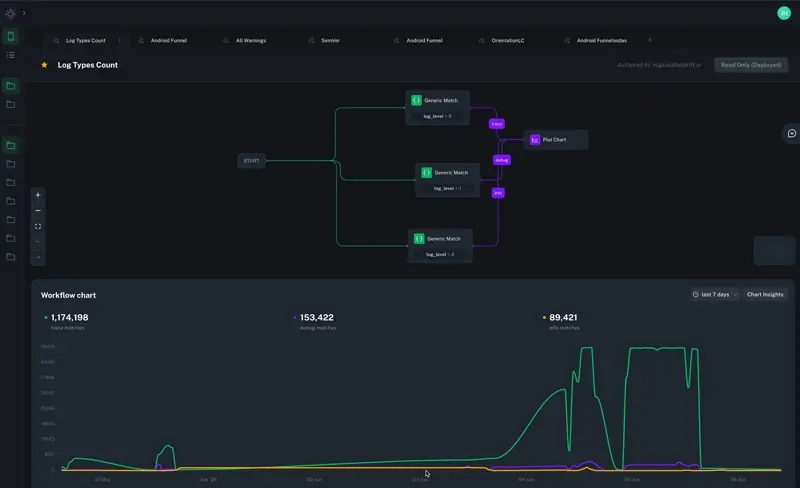
The Workflow UI has been completely redesigned to improve clarity and reduce manual configuration. Visualization is now simplified with automatic graph layouts, direct mapping of actions to their triggering matchers, and independent chart customization for titles and units. Advanced logic capabilities have been expanded with support for exit conditions using matchers or timeouts, true parallel execution with isolated flow resets, and duration-based filtering for actions. The user experience has been streamlined with redesigned configuration drawers, contextual naming for steps that auto-generates metadata, and new chart categories including Counters, Histograms, Funnels, and Sankeys. Keyboard shortcuts have also been added across most operations to significantly speed up workflows.
Charts that span both positive and negative values now display a zero baseline line, making it easier to orient yourself and understand the magnitude and direction of your data at a glance.
You can now use a negative wildcard operator in raw search on the Issues page to exclude specific patterns from your results, making it easier to filter out noise and focus on the issues you care about.
Chart tooltips now display the aggregation window time range (e.g. "10:00 – 10:05 (5m window)") for charts that have a configured aggregation window, giving you clearer context about the time period each data point represents.
Chart tooltips now snap more accurately to the nearest data point, especially for charts with sparse or unevenly spaced data.
Charts now correctly display negative values on the Y-axis, enabling accurate visualization of metrics such as battery drain rates and other signals that can fall below zero.
A new Battery Consumption Change field is now available on resource logs for iOS and Android, letting you track battery consumption trends in your charts and histograms.
You can now retrieve any page on the docs site as raw Markdown by appending .md to the URL (e.g. https://docs.bitdrift.io/sdk/quickstart.md). Requests that include a text/markdown Accept header will also receive the raw Markdown source instead of the rendered HTML page.
Issue event charts with values exceeding 10,000 now use logarithmic scaling, making it easier to spot trends and compare data points across a wide range of magnitudes without large spikes obscuring smaller values.
You can now filter spans by type in the waterfall view, making it easier to focus on specific span categories when analyzing traces.
Histogram bar charts now support filtering by dimension value, letting you isolate specific slices of your distribution data directly from the chart view.
Copying a stacktrace from an issue report now appends the associated custom fields, giving you more context when sharing or investigating crash details.
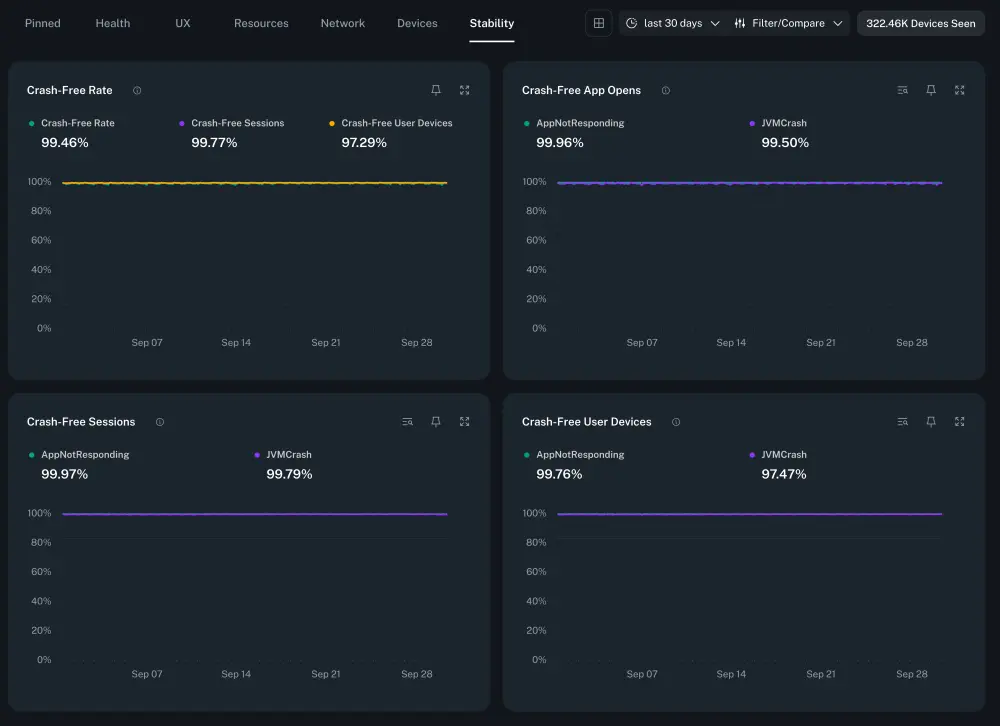
Stability insights charts (such as crash-free rate) now automatically zoom the Y-axis when values are clustered near 100%, making small variations in stability metrics much easier to see.
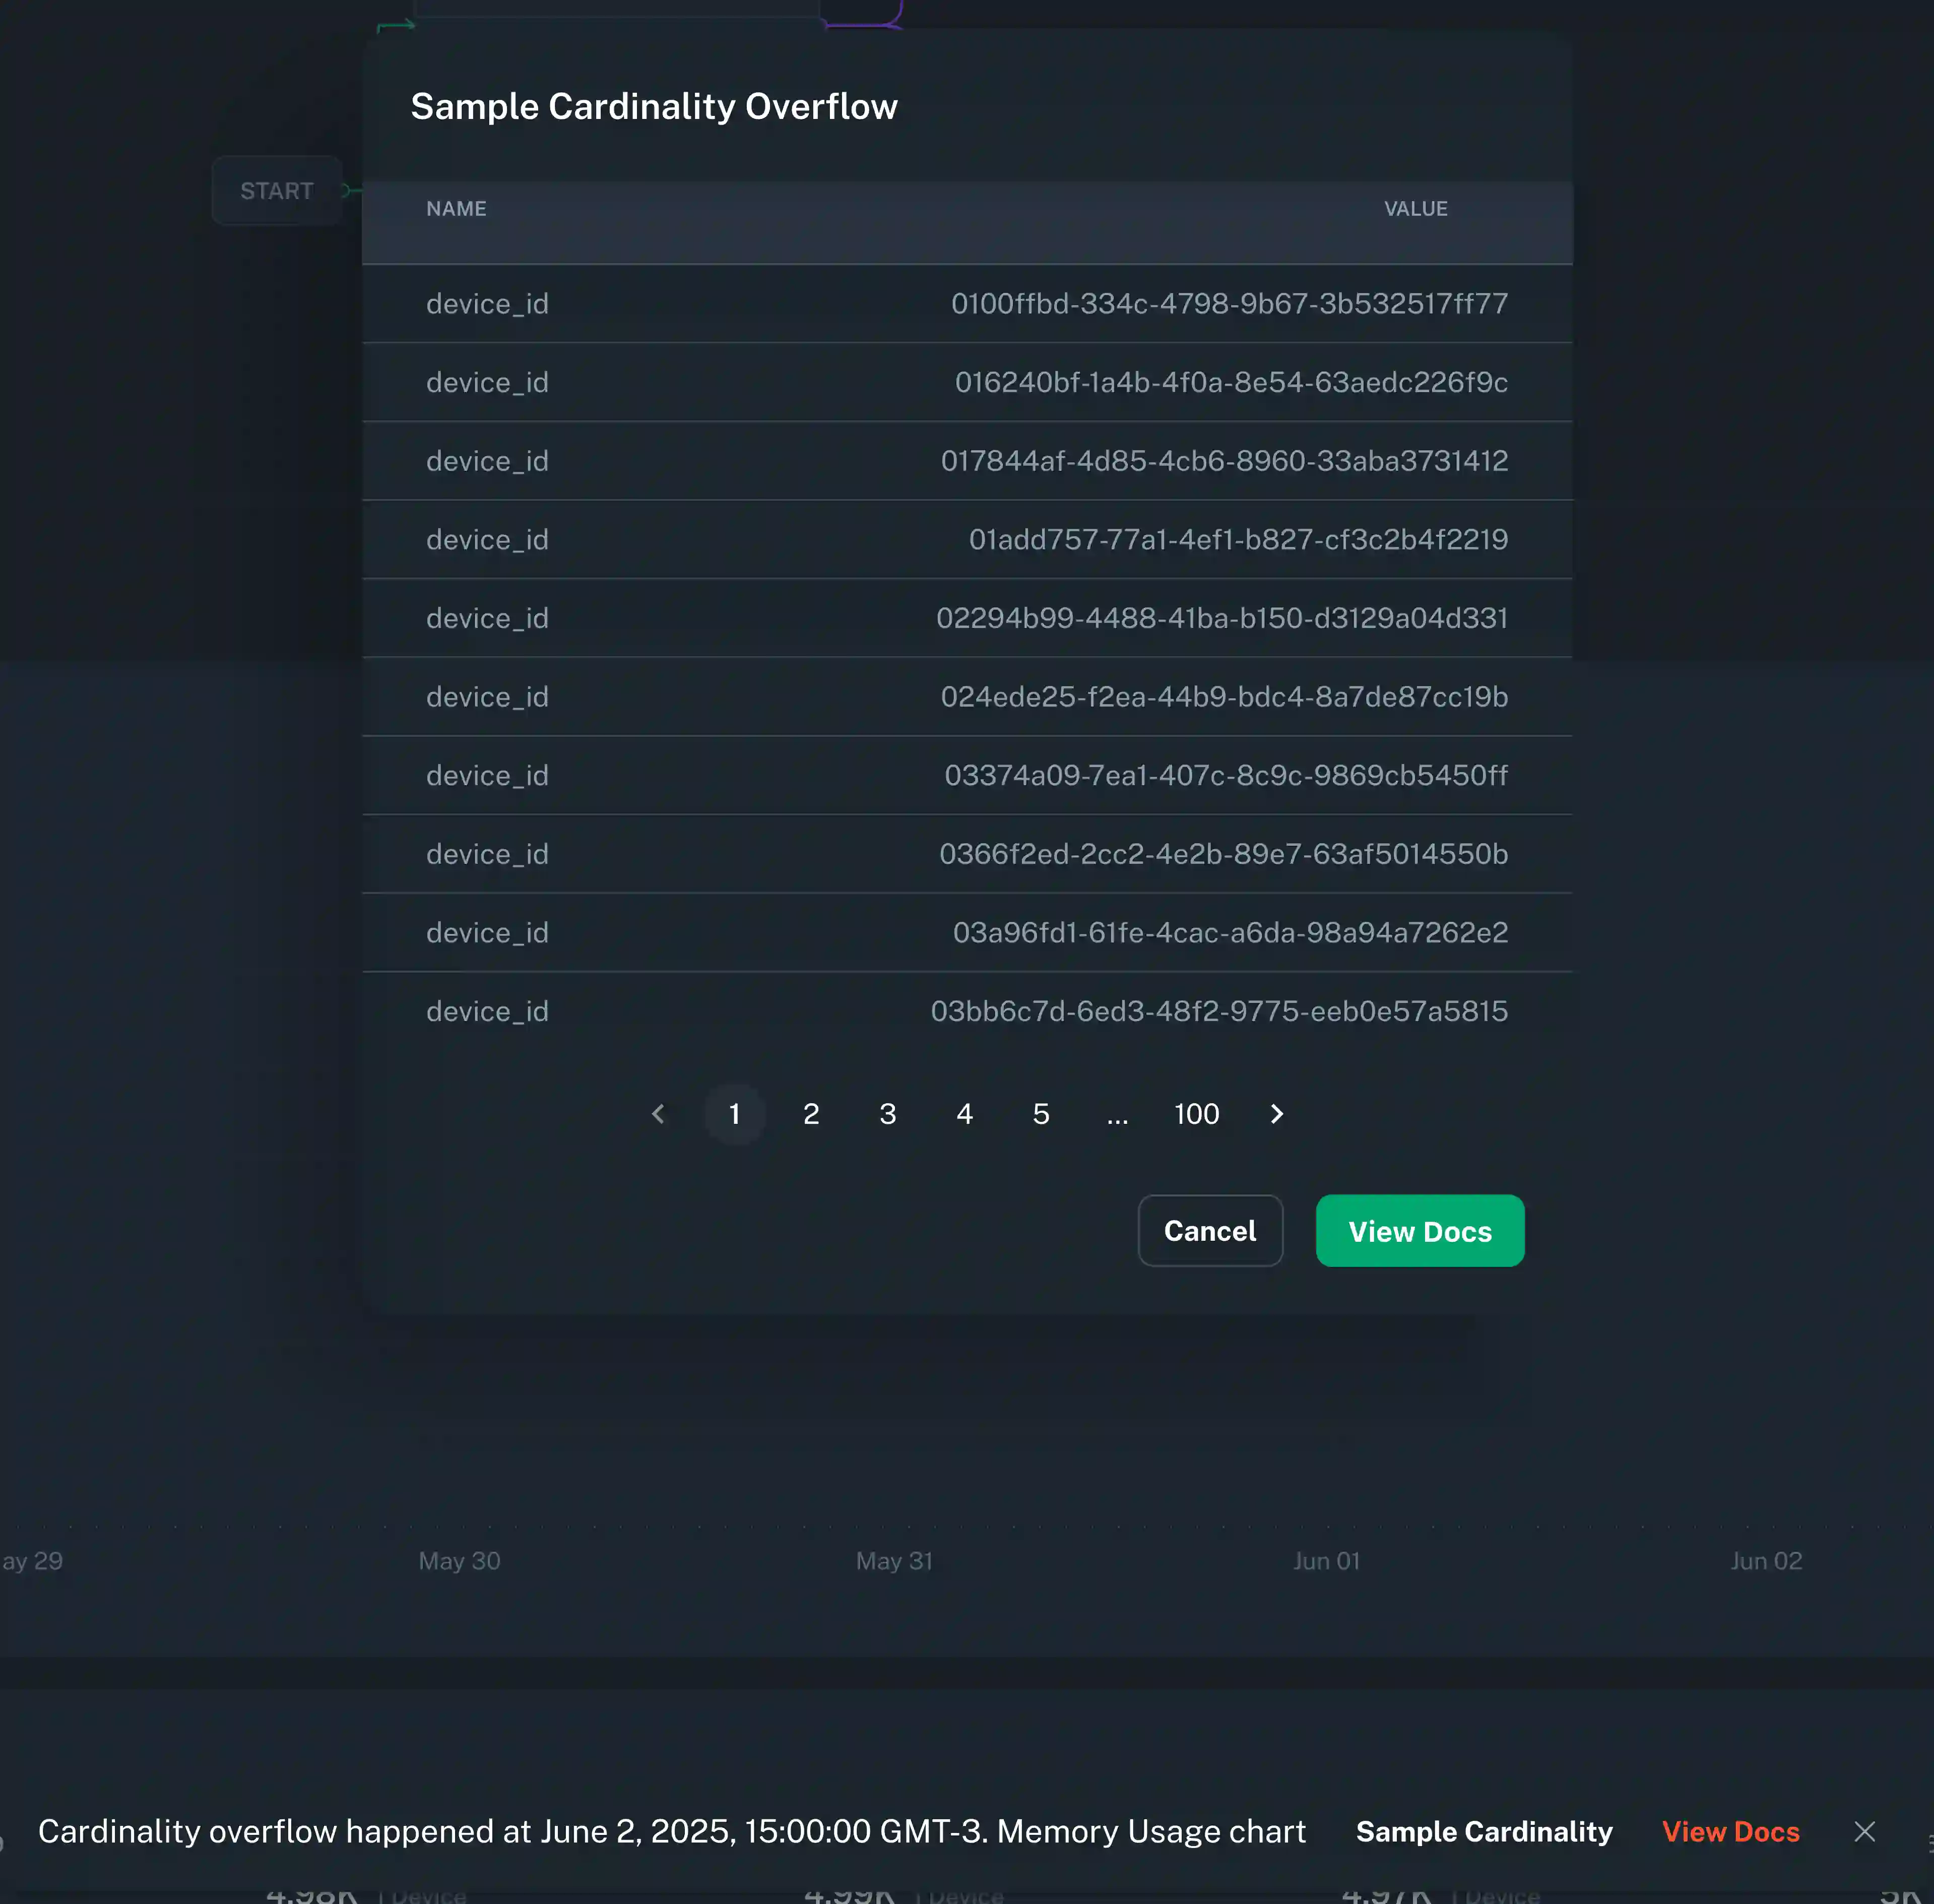
Chart tables now display aggregated row IDs and show when cardinality limits have been exceeded, giving you better visibility into how your data is being grouped and where results may be truncated.
Custom fields in the timeline now correctly render newline characters and preserve prefix characters, making multi-line and structured custom field values easier to read.
Histogram charts now support a bar chart view, letting you visualize bucket distributions and quickly compare counts across ranges.
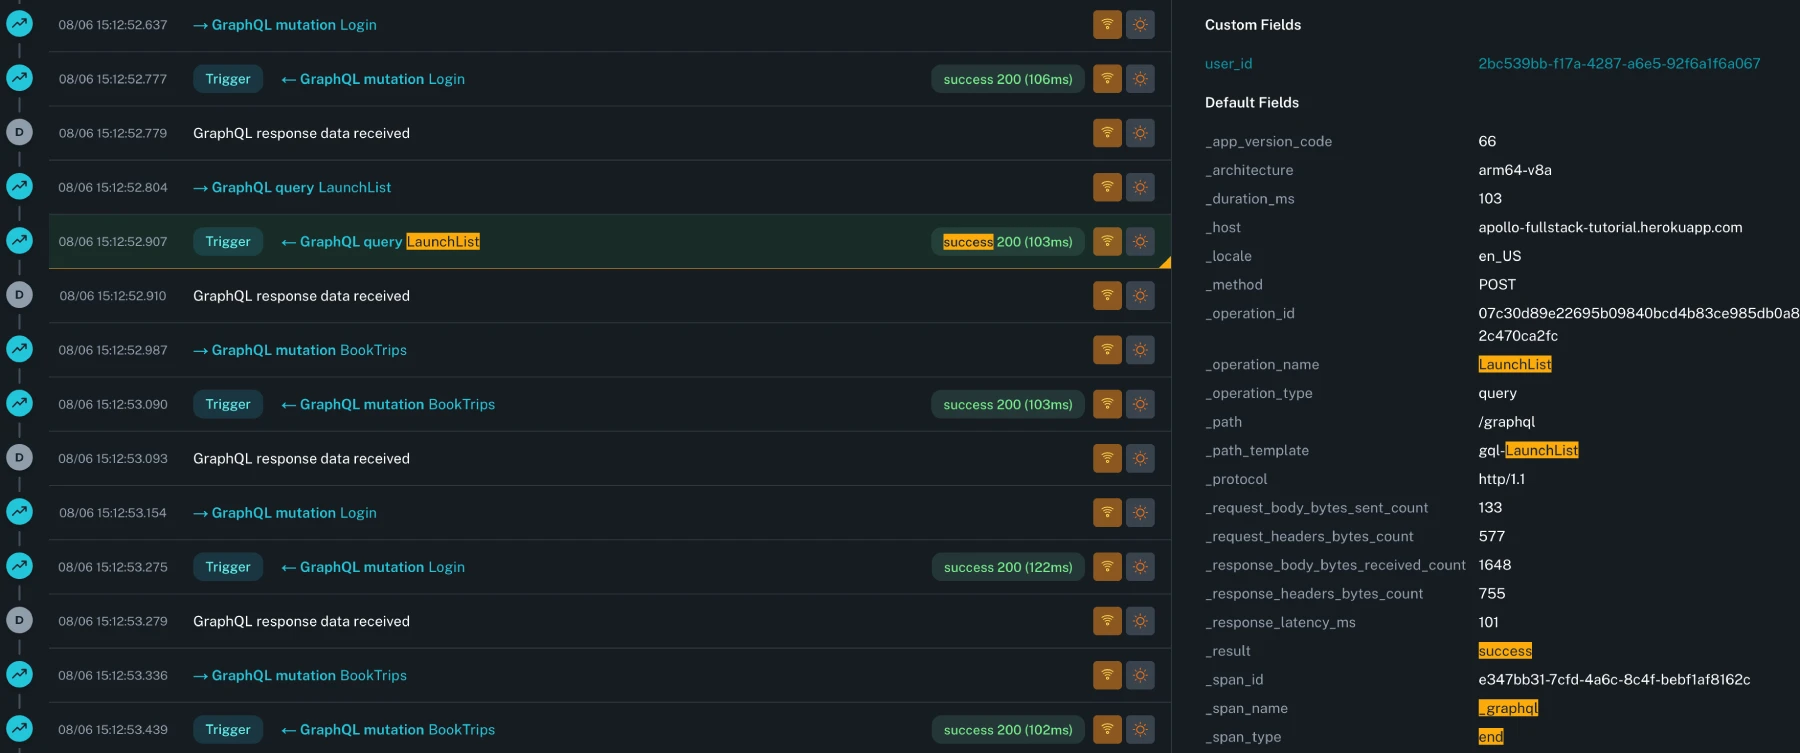
Issue report details now include a Fields tab that shows all associated log fields for a report, giving you quick access to the full context of a specific crash occurrence.
Fixed an issue where instant insights charts could show data for a different time range than the one selected in the controls when first loading the page.
Large numbers in issue details stats cards (such as affected sessions and occurrences) are now formatted with human-readable abbreviations, making them easier to scan at a glance.
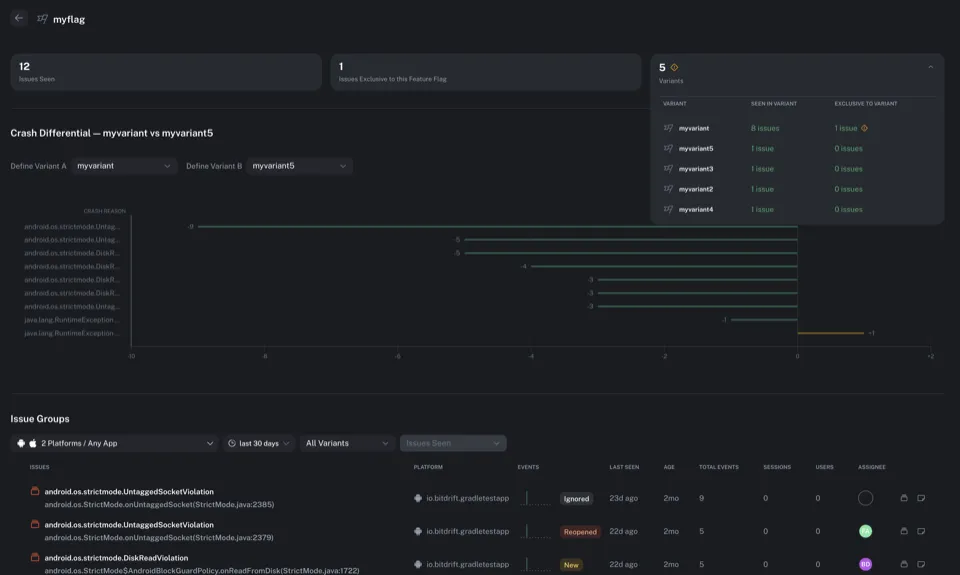
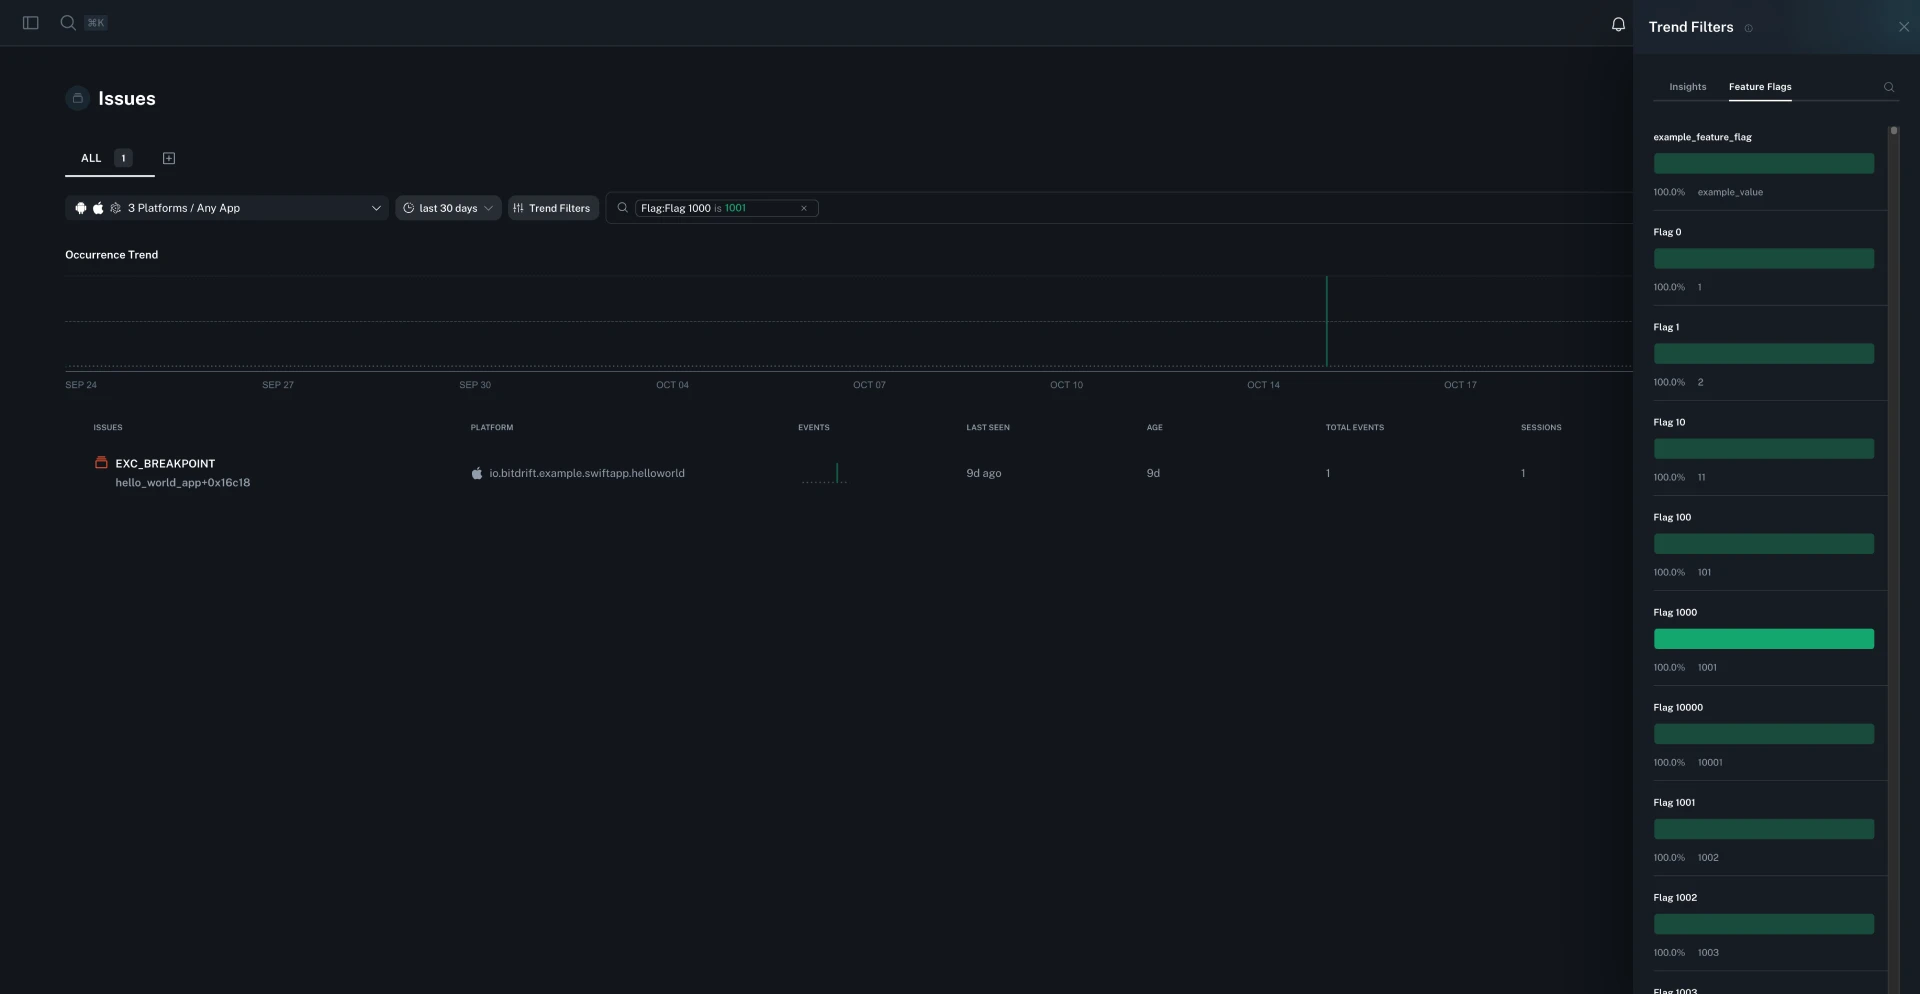
You can now browse and analyze issues grouped by feature flag. The new feature flag analysis page shows issue counts per variant, highlights variants with unusually high issue rates, and lets you compare issues across variants to quickly identify experiment-related problems.
You can now adjust the Time To Live (TTL) settings for workflows even while they are deployed, giving you more flexibility to manage workflow lifecycle without requiring redeployment.
Timeline navigation between workflow triggers now automatically expands and highlights the relevant log entry, making it easier to follow execution flow. Logs maintain their expansion state more intelligently, only auto-expanding when they were previously expanded, reducing unnecessary clutter and preserving your preferred view.
Fixed an issue where exploration deletion was allowed without proper delete permissions for all workflows in the exploration, preventing unauthorized deletion.
The capture sessions list can now be resized to fit your workflow. Drag the divider to adjust the width of the sessions list, giving you more space to view session details or more space for the main content area.
The session replay panel now remembers whether it was manually opened or closed when you navigate between sessions or refresh the page. Your preferred replay panel visibility setting is preserved across page refreshes.
The issue assignee dropdown now features improved search with pagination for faster results. You can now unassign issues directly by clicking the X button next to the current assignee without opening the dropdown.
Fixed issues causing line charts to error when empty and where workflow list updates could cause unexpected behavior.
Fixed an issue where custom dimensions were not appearing in issue group insights, preventing proper filtering and analysis of crash data by custom attributes.
Fixed an issue where the timeline could display stale data when switching between different time ranges or sessions, causing inconsistent results.
Alert notification configuration now displays a helpful hint when using @ mentions, reminding you to use Slack member IDs (e.g., @U0123456789) for reliable mentions instead of plain @ symbols.
You can now match on feature flag exposures in workflows. Create match conditions that check which feature flag variants a user is exposed to and trigger actions when a user is exposed to a specific variant. This enables targeted telemetry collection and conditional logic based on active experiments.
Charts can now be grouped by feature flag to analyze how metrics correlate with experiments. This makes it easy to compare performance, crash rates, and other metrics across different feature flag variants, helping you identify issues specific to experimental groups.
When filtering issues by feature flags, you can now specify whether to match issues where only the selected feature flags are present (exclusive mode) or where the selected flags are among any active flags (inclusive mode). This provides more precise control when investigating experiment-related issues.
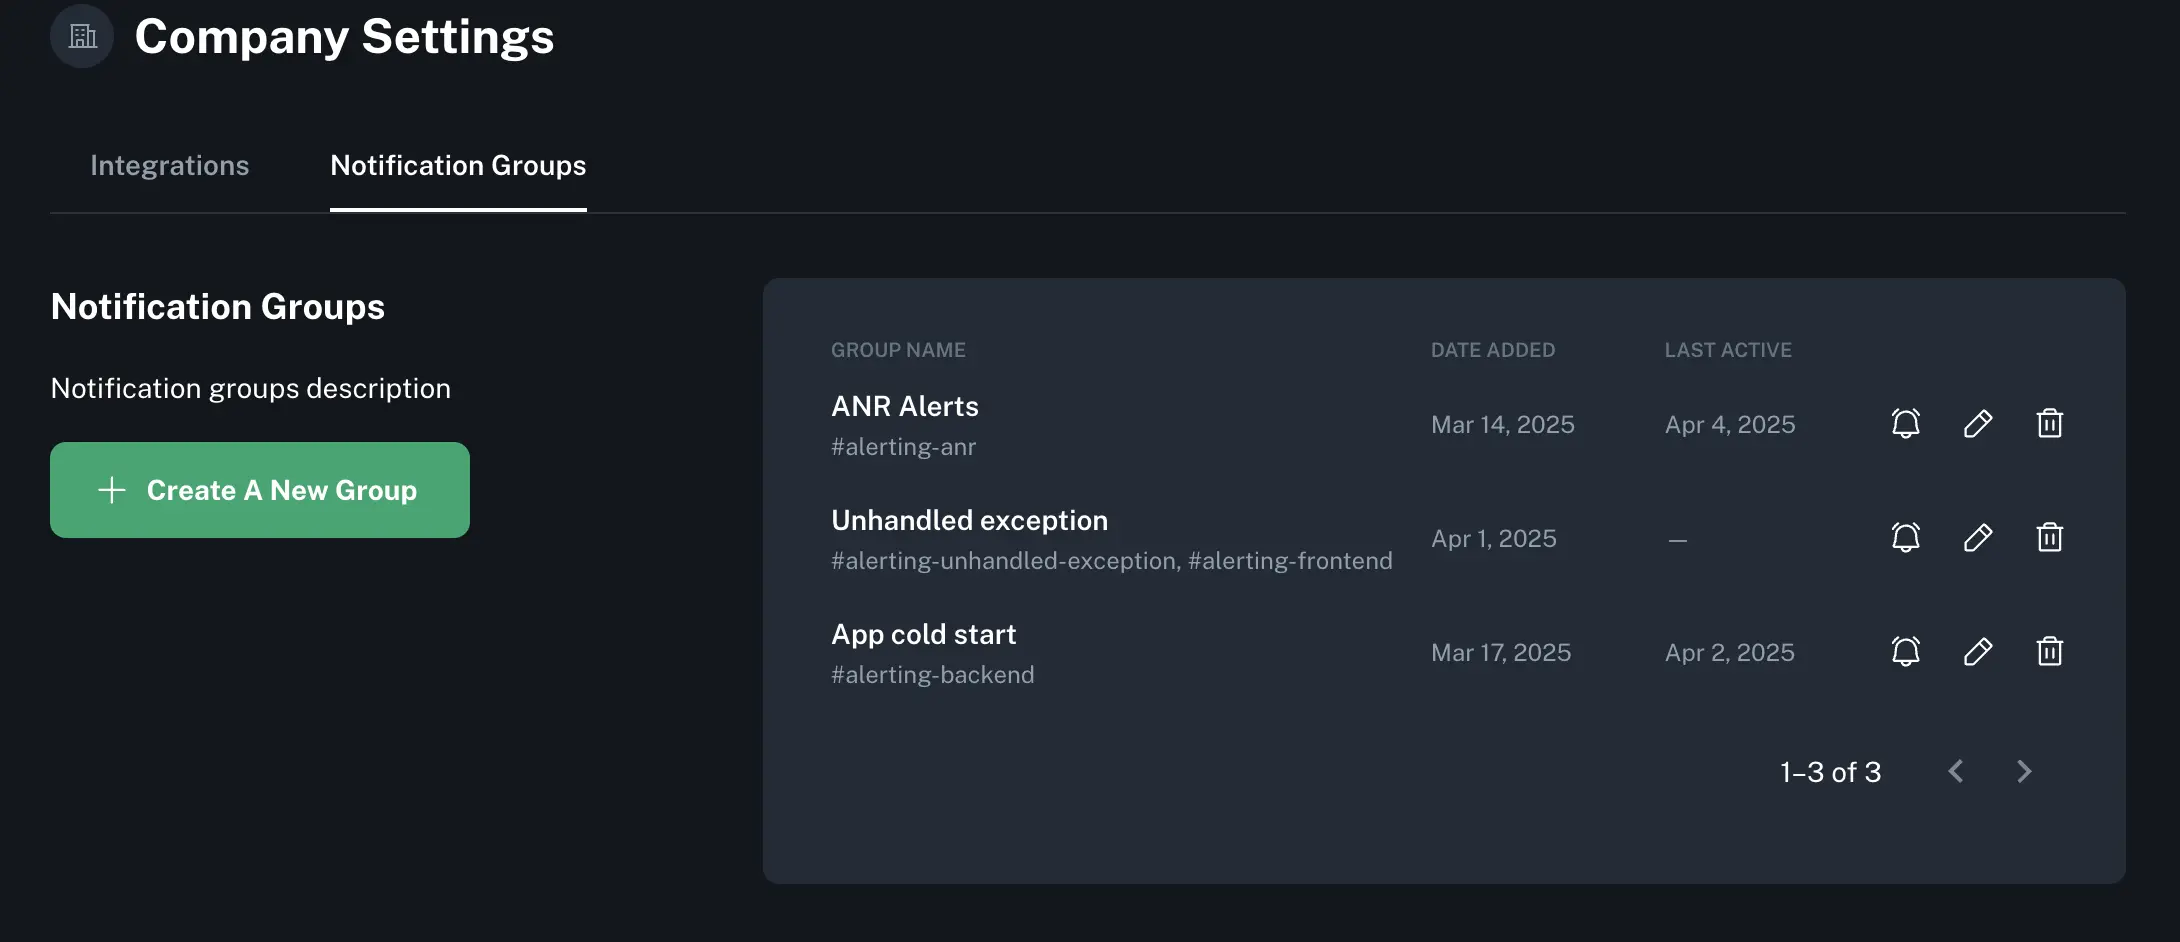
You can now send alert notifications to AWS SNS Topic. Notification Groups support adding one or more SNS Topic, enabling integration with your existing AWS infrastructure for alerting workflows. This is available on Enterprise plans alongside PagerDuty integration.
You can now configure different notification groups and custom notification text for each SLO threshold in your alerts. This allows you to escalate alerts differently based on severity. Each threshold row in the SLO configuration now includes its own notification settings.
You can now create direct links to specific charts and headings within exploration reports. Each chart and heading has a link icon that appears on hover, making it easy to share specific sections of your reports with teammates. Additionally, all editable text fields now support basic Markdown formatting for richer content.
Fixed an issue that could cause the Workflow Debugger to crash in certain scenarios.
When generating SDK keys, you can now specify an optional App ID postfix pattern (e.g., .beta, .staging). This postfix is appended to the App ID Pattern to allow additional app variants. For more details, see the documentation.
Workflows can now be configured with a TTL (Time To Live) expiration, which will apply when deployed. When enabled, workflows automatically expire after a specified number of days without being viewed. This helps manage your deployment slots by ensuring inactive workflows are automatically stopped, freeing resources for new workflows. Workflows with active alerts are exempt from TTL expiration. For more details, see the documentation.
Notification groups are now optional when creating or editing alerts. This allows you to configure alerts without immediately setting up notifications, giving you more flexibility to define alert conditions first and add notification channels later.
You can now assign team members to specific issue groups, update issue status (In Progress, Fixed, etc.), and filter the issue list by assignee or status.
You can now specify a unique devices threshold when configuring basic alerts. This allows alerts to only trigger when a minimum number of unique devices are affected.
Fixed a bug where moving a workflow was mistakenly allowed without the necessary permissions, resulting in an error.
You can now send alert notifications to PagerDuty. Notification Groups support adding one or more routing keys. This integration streamlines escalation, reduces manual triage time, and complements existing Slack notifications. To enable it, add PagerDuty routing keys in a notification group.
You can now select and view multiple percentiles simultaneously on single-series histogram charts. This makes it easier to analyze performance distributions and identify outliers across your data. Additionally, it is now possible to select arbitrary custom percentiles to view.
The Workflow Debugger now displays a warning when the connected device's platform doesn't match the workflow's target platform. This helps prevent confusion during debugging and makes it immediately clear when you need to connect a device with the correct platform.
Improved the visibility and accessibility of the workflow overflow menu in Explorations. The menu is now directly exposed in the workflow runner bar, making common actions easier to discover and reducing unnecessary clicks.
Fixed an issue where clearing all advanced search queries in Timeline would leave previously loaded result pages cached, sometimes showing stale or partial results. Removing all queries now correctly resets the search state so the timeline reflects the full, unfiltered session immediately.
Adjusted the height of the Rule Flush output panel in Explorations to provide a subtle visual cue that more content is available when scrollbars are hidden, improving discoverability of long result lists.
Fixed an issue where using 'Filter by results' with a search that matched no logs would not display an empty state as expected. The timeline now clearly shows that there are zero matching logs, making it easier to understand when a query needs adjustment.
Updated the raw text search behavior in Issues to use 'contains' matching instead of requiring an exact match. This makes it easier to surface relevant issues without knowing the precise full text. Existing saved searches continue to work, but may now return broader, more helpful results. If the search contains wildcard characters, those will be respected as-is.
Stack traces in Timeline now use the same styling and in-app frame highlighting as the Issues page, making it easier to visually scan and correlate crashes across views. In addition, expanded log details remain accessible at all times (no longer conditionally hidden), so you can drill into structured fields without losing context while navigating.
You can now download the entire timeline session data as a JSON file directly from the Timeline view. This feature is available via the command palette (Cmd/Ctrl + K) and a new keyboard shortcut (Cmd/Ctrl + Shift + D).
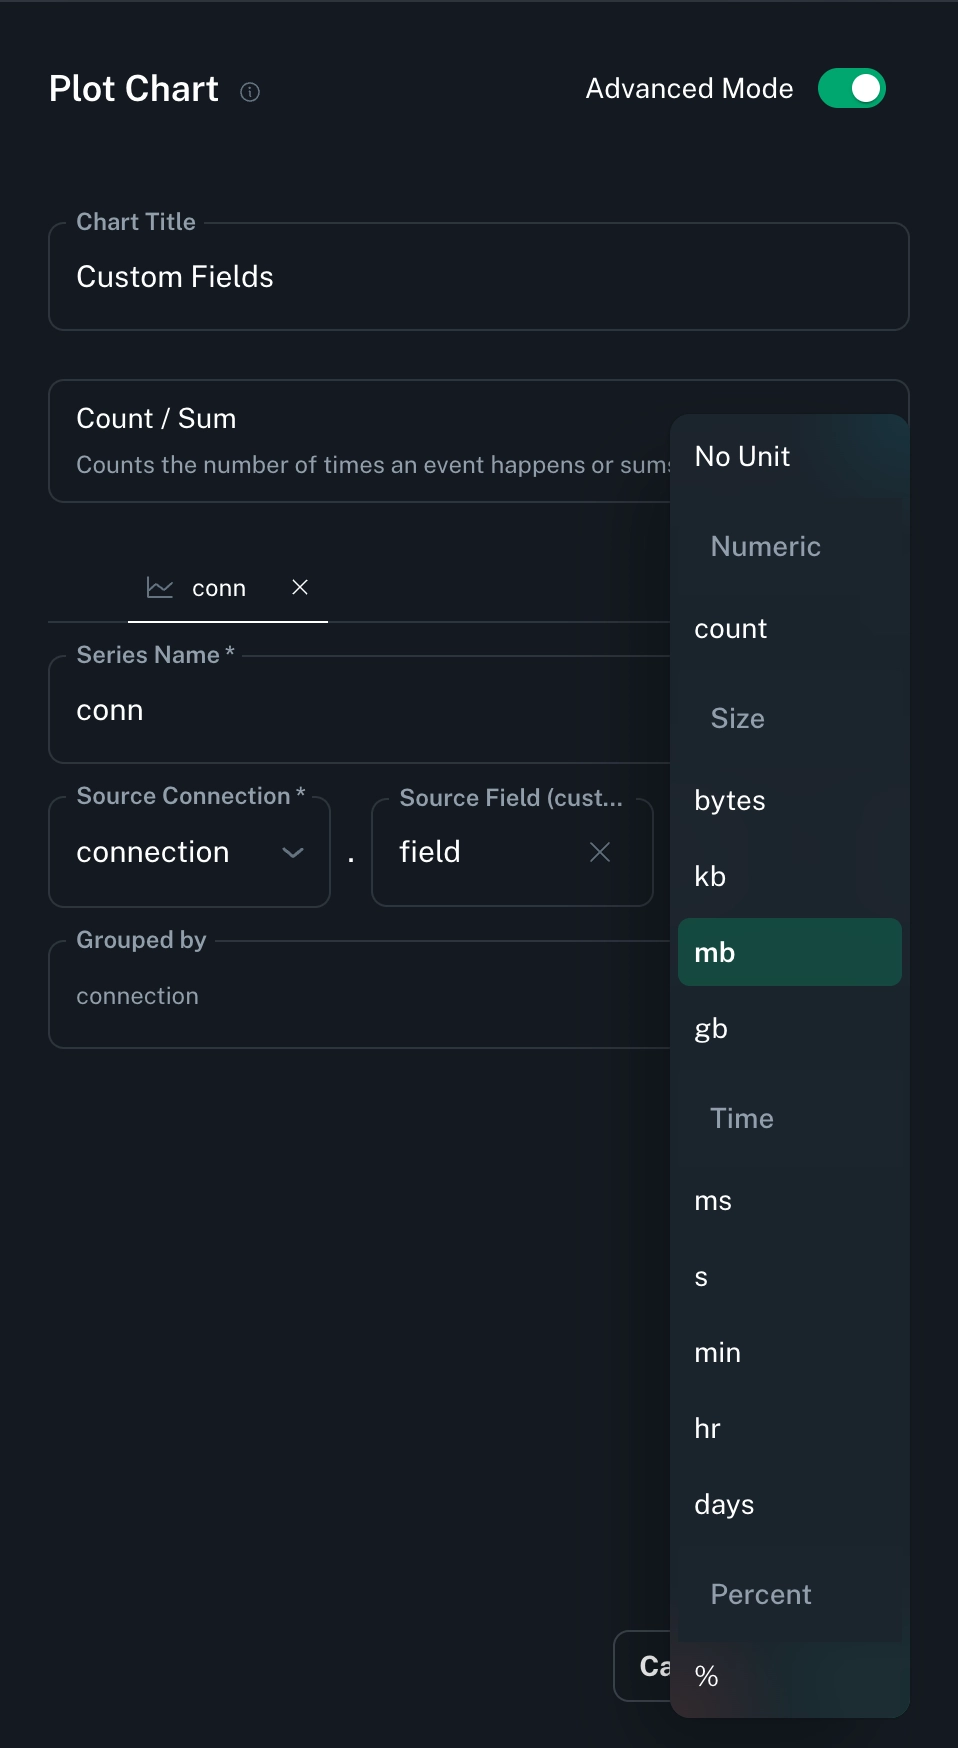
Added support for new units like seconds, minutes, hours, days, and gigabytes across charts. Dropdown menus now categorize units for easier selection.
You can now set fractional thresholds for issue alerts, with validation for percentage inputs (0–100, up to two decimals). This update improves precision and usability when configuring alert conditions.
Resolved an issue where selecting a range on line charts with empty datapoints could cause the selection to fail or behave unexpectedly.
You can now view and filter issues by feature flag exposure. This update adds insights into which feature flags were active for affected users, making it easier to correlate issues with experiments and feature rollouts. Filter issue reports by specific flags to quickly identify the impact of new features or experiments. For more details, see the documentation.
We've added a powerful new Workflow Debugger to the Capture portal, a real-time visual tool for developing and validating workflows directly against live or simulated devices. The debugger provides live log streaming, instant feedback on matched workflow steps, real-time step execution counts, and integrated views of session replay and resource utilization. It dramatically simplifies debugging complex workflows and ensures accuracy before deployment.
Issue Views in the sidebar now display a color-coded icon when alerts are configured for that view. Views with active alerts appear in red, making it easier to identify which segments of your app are being monitored at a glance.
Fixed an issue where issue group filters that started with a raw search were not correctly displaying the filter overflow count.
Fixed an issue where filters from the issue groups list page were not being passed through to the details page correctly.
A new Stability category has been added to Instant Insights, showing your app's Stability Score—the percentage of users who remained crash-free over the selected time range and/or releases. Charts break down crash-free rates by app opens, sessions, unique devices, and crash types. For more details, see the documentation.
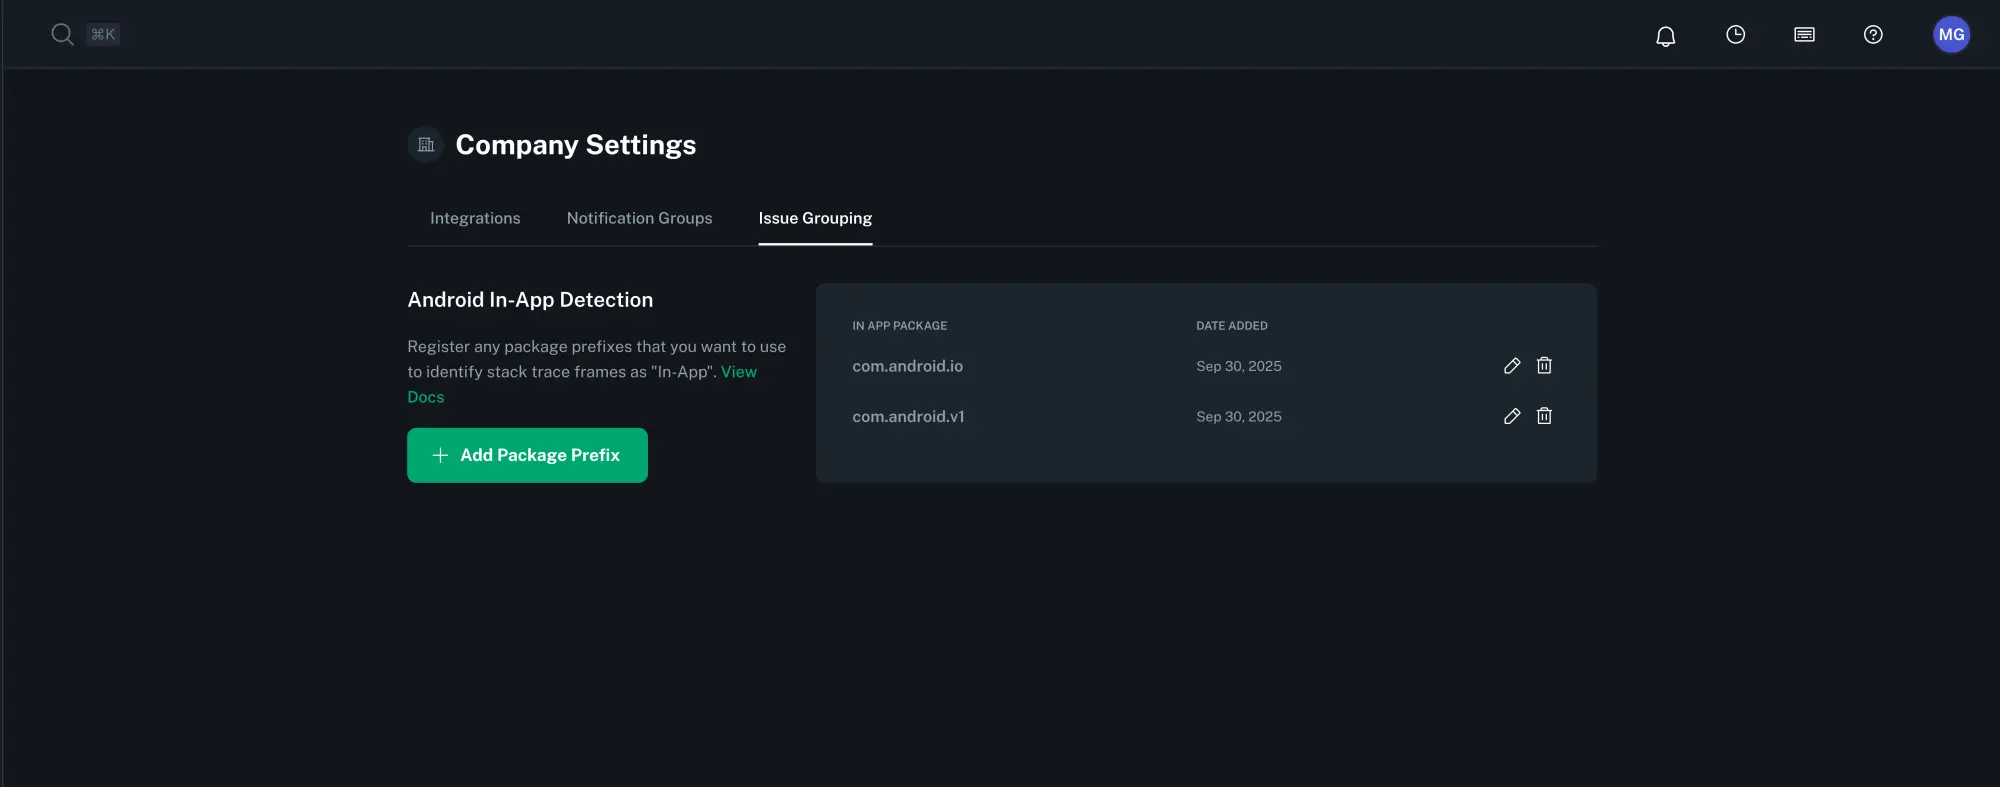
You can now register Android package prefixes in Company Settings > Issue Grouping to improve crash symbolication. Once configured, any stack frames beginning with your app’s package name (e.g., com.company.app) are automatically attributed as in-app, making it easier to identify and focus on the parts of the stack trace that belong to your code. Previously ingested crashes are not updated retroactively.
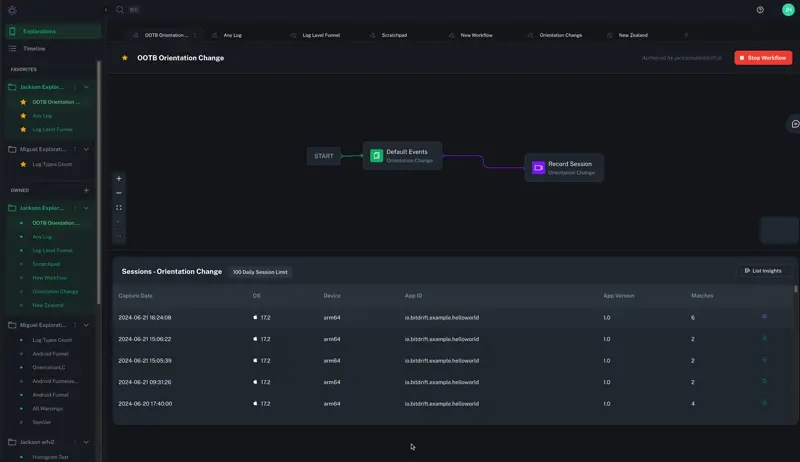
The Explorations sidebar now always includes the 'Currently Viewing' section at the top so the exploration you're viewing is clearly identified, even if it already appears in Favorites or Owned. This makes it easier to orient yourself when switching between saved explorations.
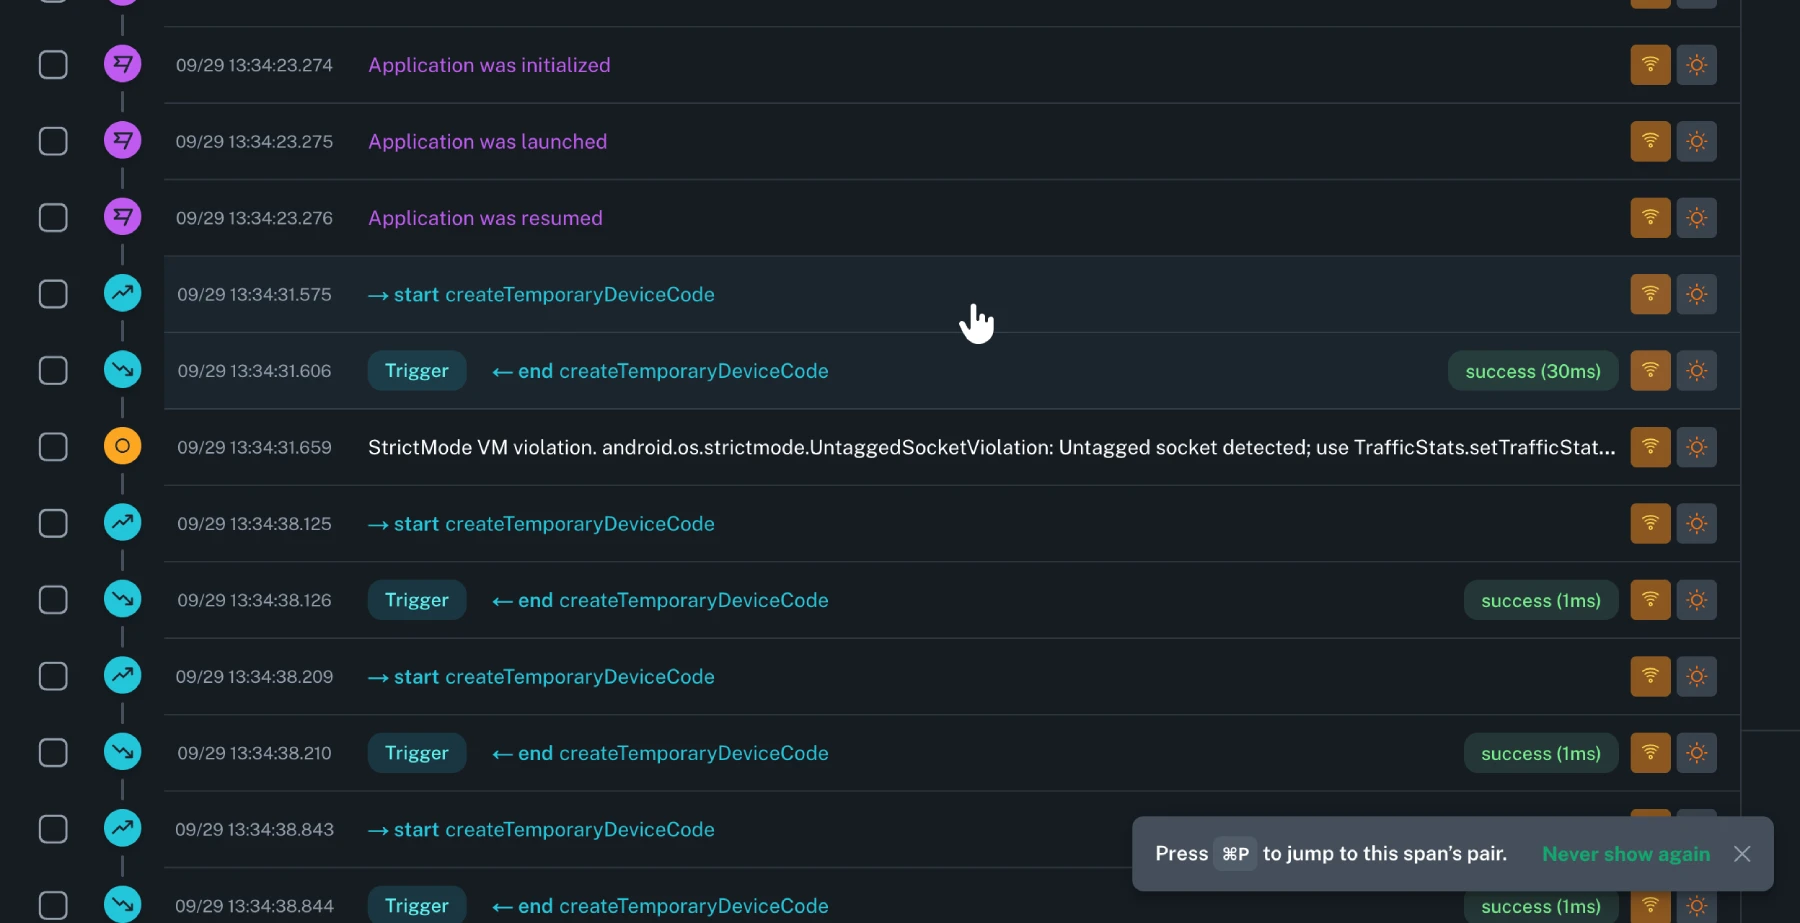
You can now highlight related spans in the timeline table. Hovering or focusing a span will subtly highlight other spans that share the same linkage (e.g. dynamically created spans that represent the start and end of the same operation), making it easier to follow end-to-end latency and understand parallel work. This reduces visual noise and speeds up investigation of performance bottlenecks. In addition, a new keyboard shortcut (⌘/Ctrl + P) has been added to jump between linked spans.
Fixed an issue with unowned workflows that would sometimes show a "Cannot update workflow" error when no changes were made.
Fixed an issue where using Cmd (macOS) or Ctrl (Windows/Linux) + click on links would not open them in a new browser tab as expected.
Explorations rate charts now use aggregated rollups for calculating averages, improving accuracy when comparing performance over longer time ranges.
When running the app in debug mode, an on-screen indicator now makes this state obvious to help avoid confusion when testing.
Optimized the 3D session replay experience for smoother interaction when navigating complex sessions.
Crash issue views now highlight when symbol files are missing and list all detected symbol files to streamline symbolication fixes.
Reduced overhead in session replay rendering for faster load times and navigation in larger sessions.
Issue details now read the app version and version code directly from available reports, improving accuracy of version metadata without manual entry.
New connections in the workflow editor now receive initial automatic names, reducing setup time when building workflows.
Timeline advanced search now supports paginating result sets when using filter mode, making it easier to work with very large search matches.
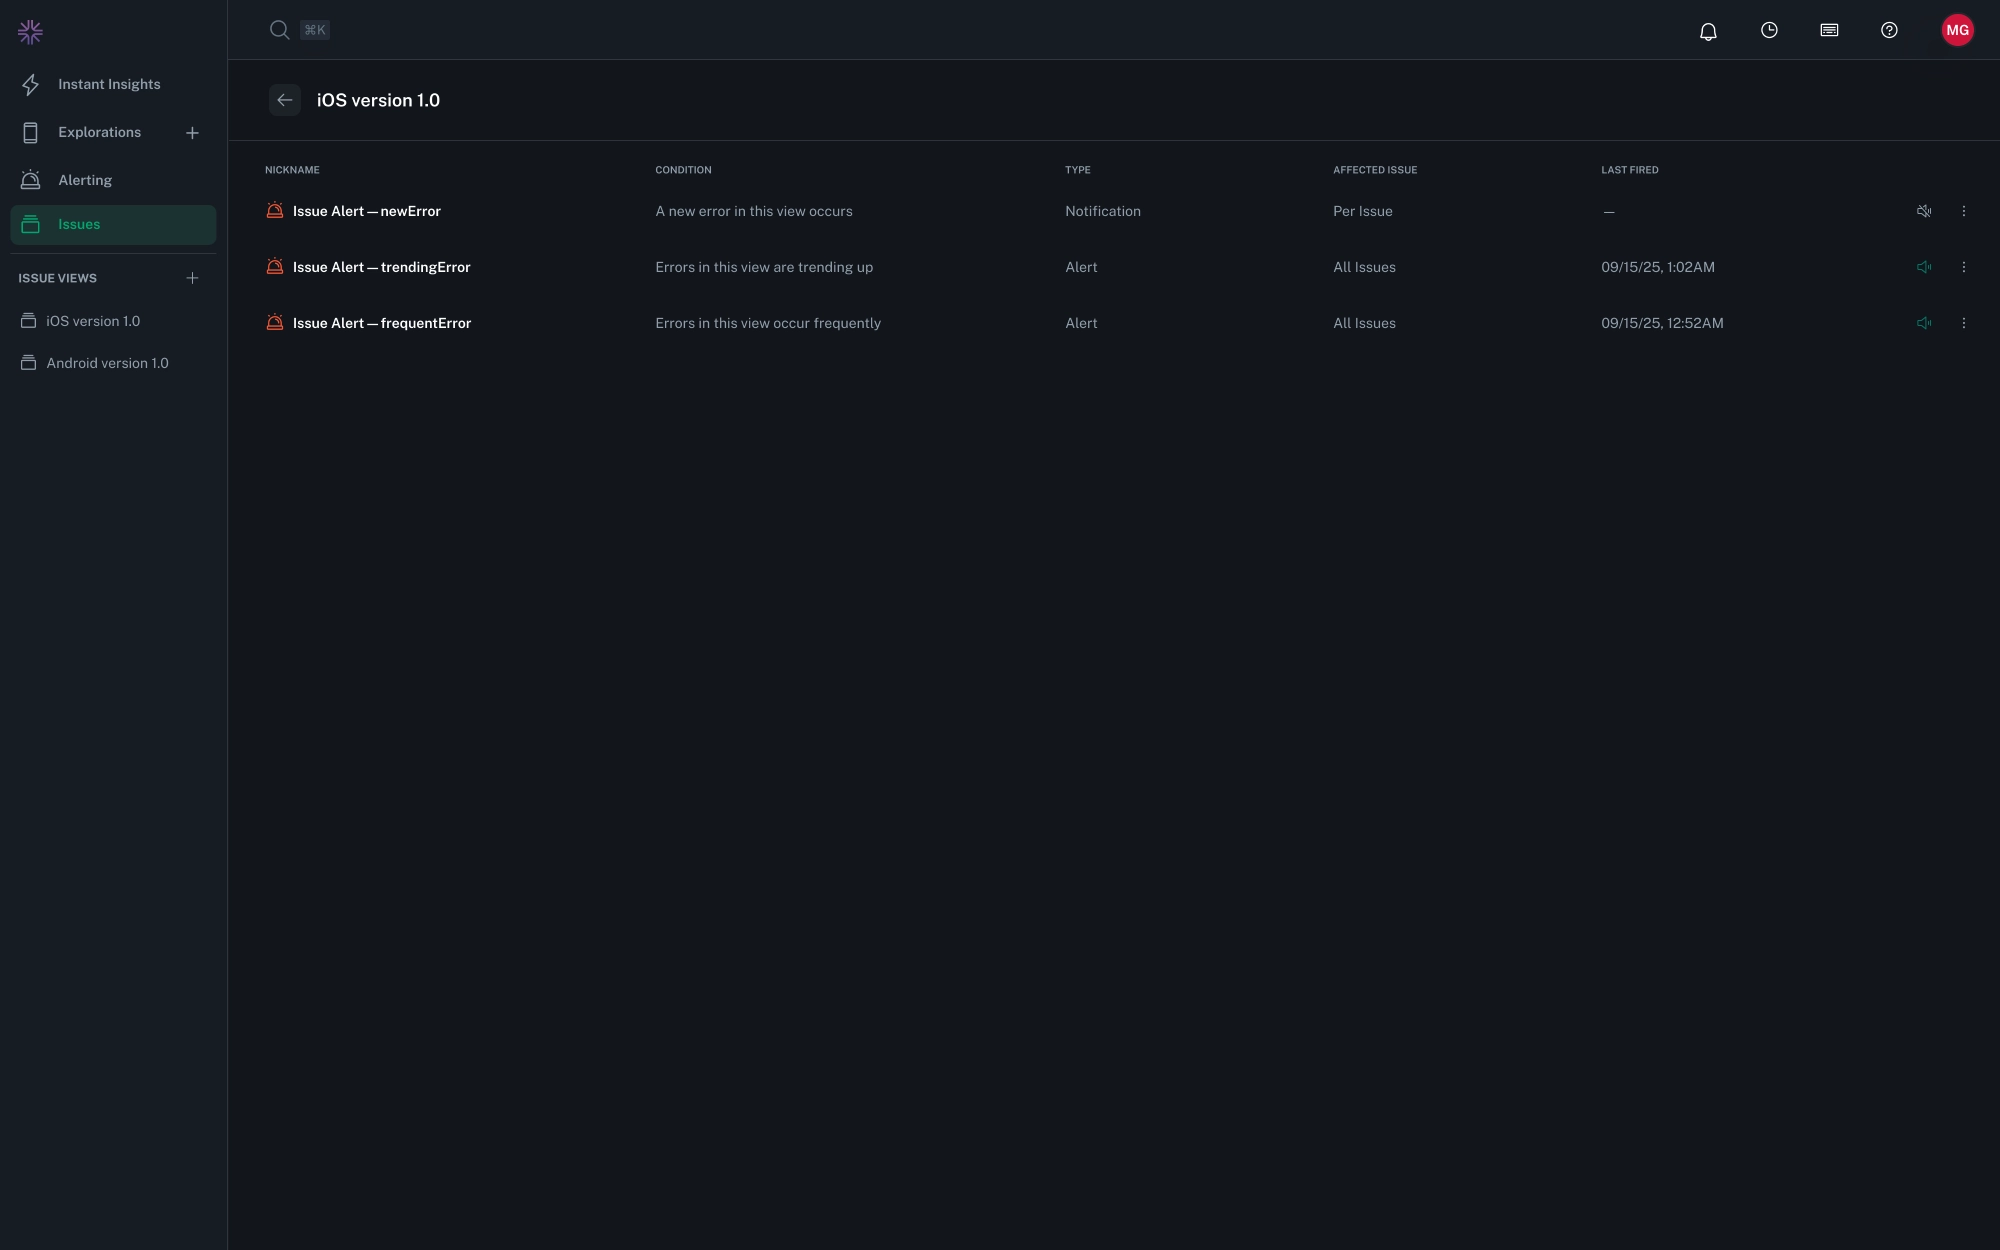
You can now configure alerts and notifications on saved Views to proactively monitor fatal issues and crashes. Alerts help you track ongoing patterns like frequent or trending errors, while notifications fire instantly for new or every error events. For more details, see the documentation.
The Fatal Issues and Crashes feature is now generally available to all users. This feature provides enhanced insights into application crashes, helping you identify and resolve issues more effectively. For more details, please refer to the documentation.
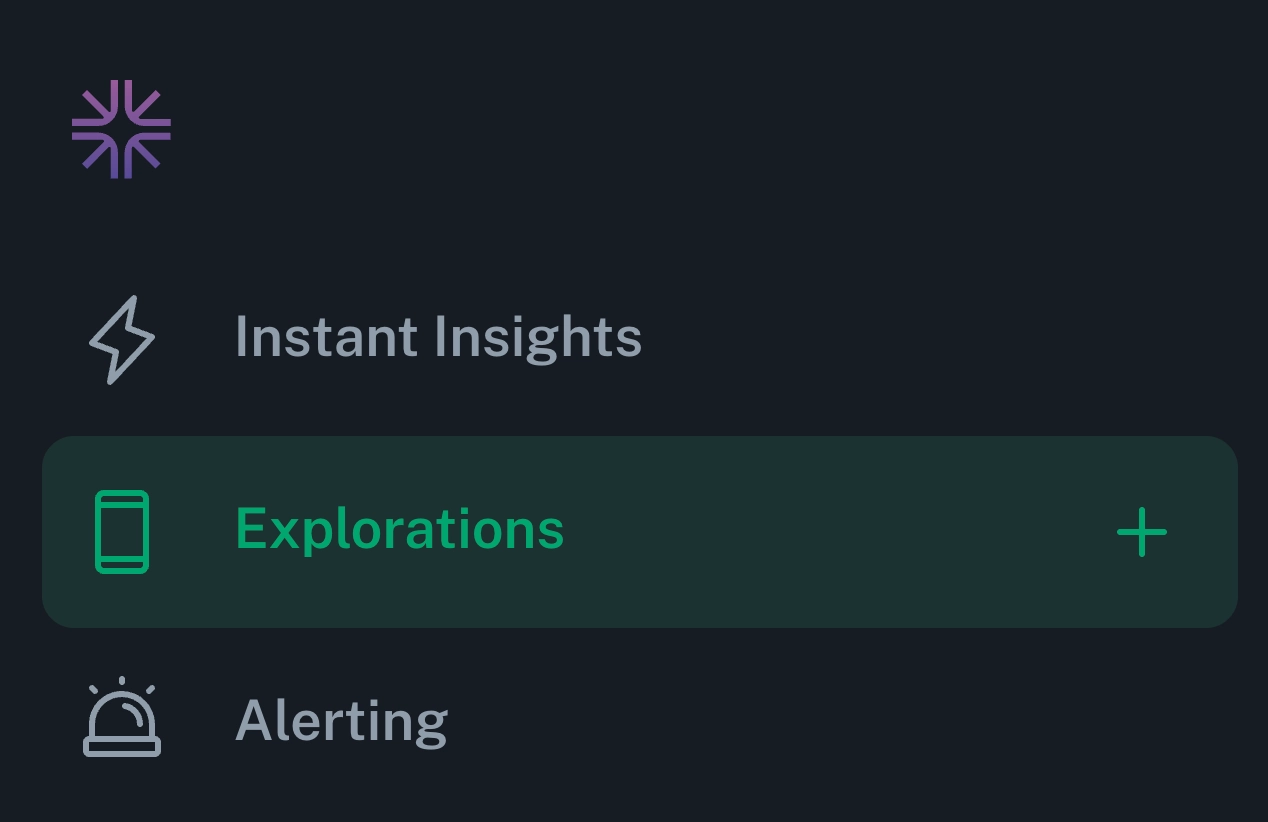
You can now create a new exploration from the '+' button in the Explorations view.
Fixed an issue where some users encountered an error rendering the standalone session replay view.
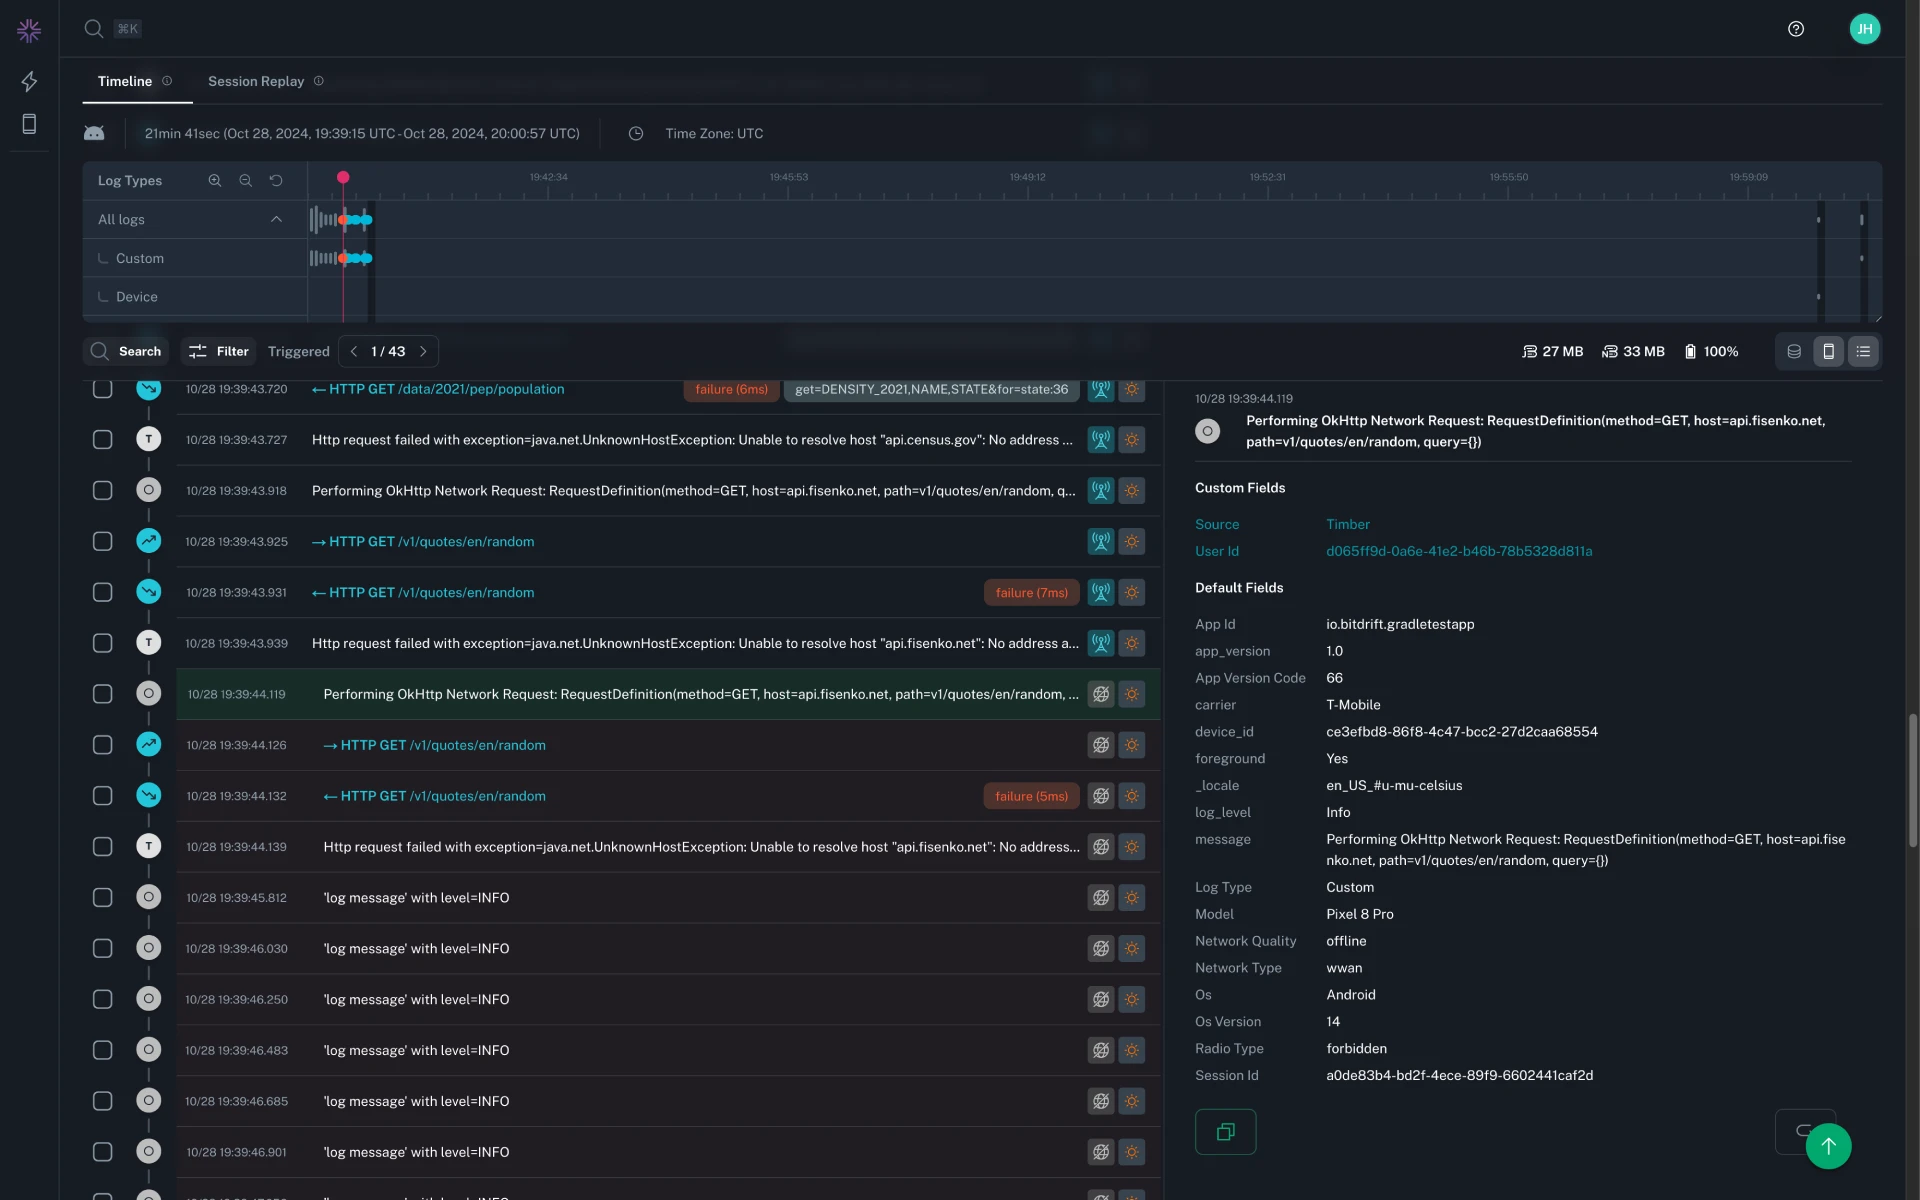
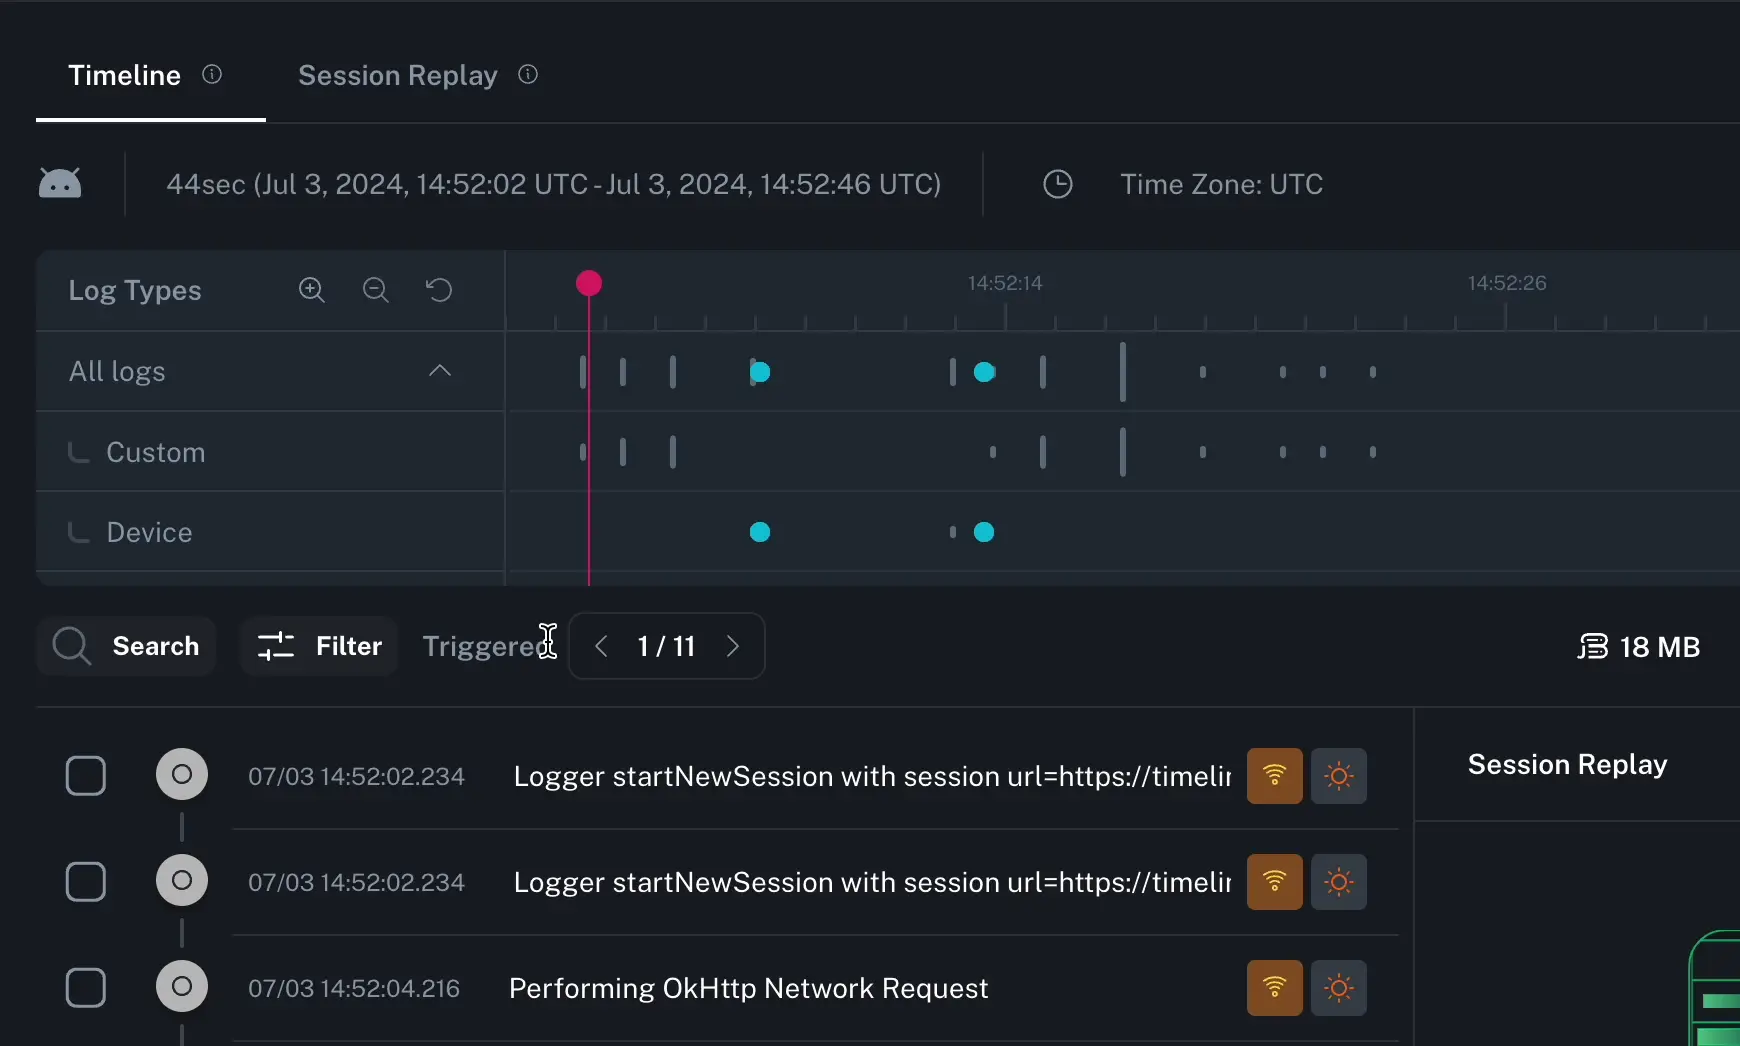
The search functionality in the timeline has been enhanced to provide more accurate and relevant results. You still have the ability to perform a raw text search across the logs within a session, but in addition to this you can now target specific fields with the logs. For targeting nested JSON queries, JSONPath syntax can be used.

How search results are highlighted has also been improved. There is now a visual distinction between a log which matches due to the inline message vs one which matches a nested log field. In addition to this, text matches will be highlighted within the inline log message, tags, and nested fields in the expanded log details.
The old timeline filters have been deprecated in favor of searching within the new timeline search bar. Searching by log level and log type is supported, similar to the old filters. Convenient shortcuts have been added for more complex filtering by Span Success/Failure and Networking Success/Failure. When searching, the Filter by results toggle can be switched to show only matching logs.
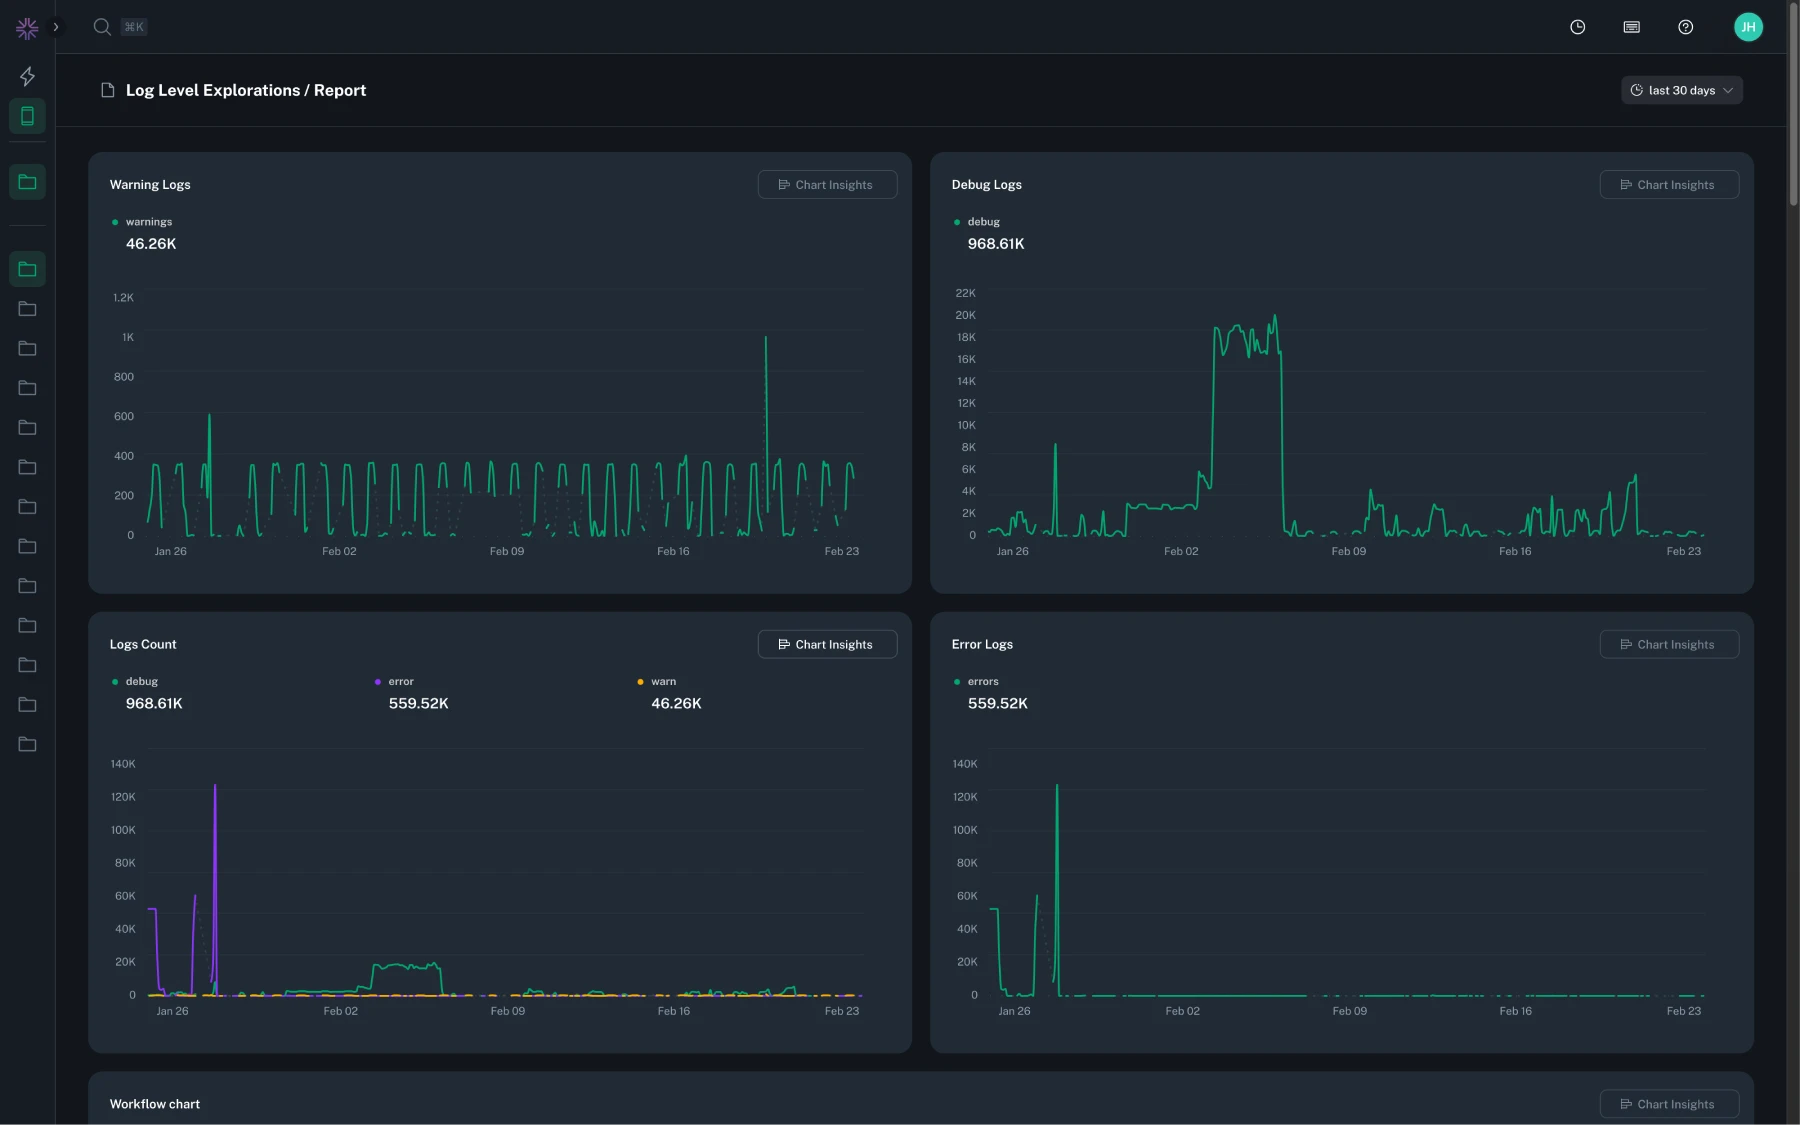
The user can now customize the Exploration Reports (automatically created for each Exploration, consisting of all outputs of Workflows in an Exploration) by selecting the desired visualizations and shape/order/edit the way they're presented to the users.
You can now define variables on a per-workflow basis, enabling field-based filtering in exploration dashboards. Variables are selected from known fields or added as custom values, and only the intersection of all selected variables will be available in the dashboard.
To reduce confusion, expanded log details will now show only the raw field name. This change is intended to clarify the information presented in the timeline, making it easier to understand and create workflows which target those fields.
Resolved an issue where Plot Chart nodes in workflows duplicated from an Instant Insights workflow would display an error when edited.
The workflows list in the explorations sidebar has been decluttered by hiding 'unowned' workflows by default. You can still find these workflows on the explorations home page. Workflows that have been favorited will continue to be visible in the sidebar, so you can curate the list more effectively.
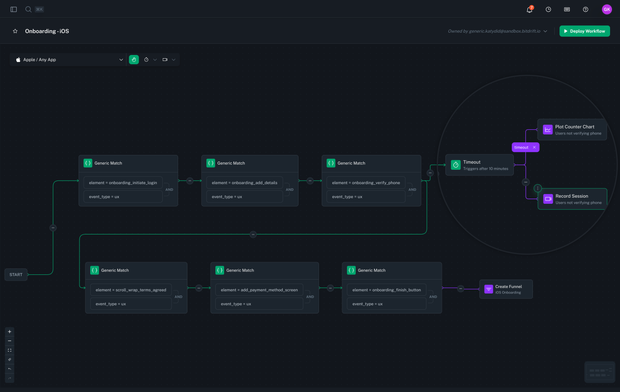
Workflows can now match on inactivity using the new Timeout Matcher. This allows you to trigger actions when nothing happens for a configurable amount of time, unlocking use cases like abandoned onboarding, stalled requests, and other forms of silent failure.
Charts now detect when a series exceeds the cardinality threshold. When this happens, a warning toast will appear with options to view an example chart or read the documentation.
Following Google's guidance on deprecating the usage of trim callbacks on Android, we have stopped supporting reporting on matching those levels altogether. Upgrade to Android SDK v0.17.16+ to track low memory events.
All plot charts can now be displayed in a table view, providing an alternate representation for easier data analysis.
All newly created charts now include support for tracking the number of unique devices contributing to each datapoint and aggregated total.
Rules now support grouping by multiple fields, making it easier to analyze and compare across several dimensions in a single chart.
Session replay playback rate controls have been updated to include 4x and 8x speeds, allowing for faster review of sessions.
Across all products, the sidebar is now resizable, and will remember the last used size.
When creating a dynamic span, you can now group by any default attribute. This allows to create multiple series for the same span, making it easier to analyze performance across different dimensions.
The new waterfall view offers a Gantt-style visualization of spans, helping you understand the performance of asynchronous operations in your applications. By displaying spans in a hierarchical timeline, you can easily identify bottlenecks and optimize complex workflows. This visualization enhances your ability to analyze and improve application performance.
We've introduced dynamic spans, enabling you to measure the time between any two logs within your workflows. No code changes required. This feature allows you to define spans dynamically based on existing logs, providing flexibility in tracing and performance analysis. It's particularly useful for mobile applications, where deploying new code can be time-consuming.
Spans can now be created with explicit start and end times, offering precise control over tracing. This enhancement allows you to define spans times programmatically, capturing specific durations of interest within your application's execution.
You can now include Slack mentions in alert messages to notify specific users or teams using their Slack IDs.
After creating an alert, users are now taken back to the workflow they started from.
Testing a notification group now displays a separate error message for each Slack channel that fails.
App and platform filters are now visible when viewing a deployed workflow.
Changed alerting menu icon on charts to improve visibility.
Added the ability to send a test notification to a notification group.
Fixed a bug where session search filters were not working as expected.
Fixed a bug where the Sankey chart could cause the browser tab to hang when updating with unchanged data.
Changed alert icon to a pulse animation with a badge displaying the number of firing alerts.
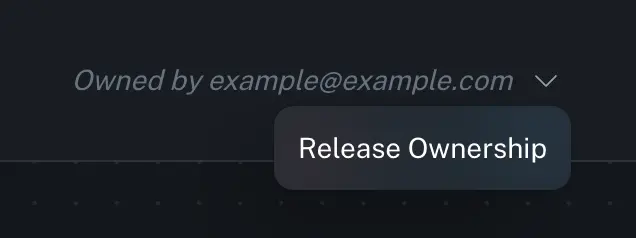
Updated designs on change ownership.
Moved the percentile selection control into the Alert Condition section for a more intuitive configuration experience.
Fixed an issue where duplicating a workflow that you don't own did not enable the move action until a hard refresh was performed.
Adjusted the deployment process so that workflows automatically fit to screen when being stopped.
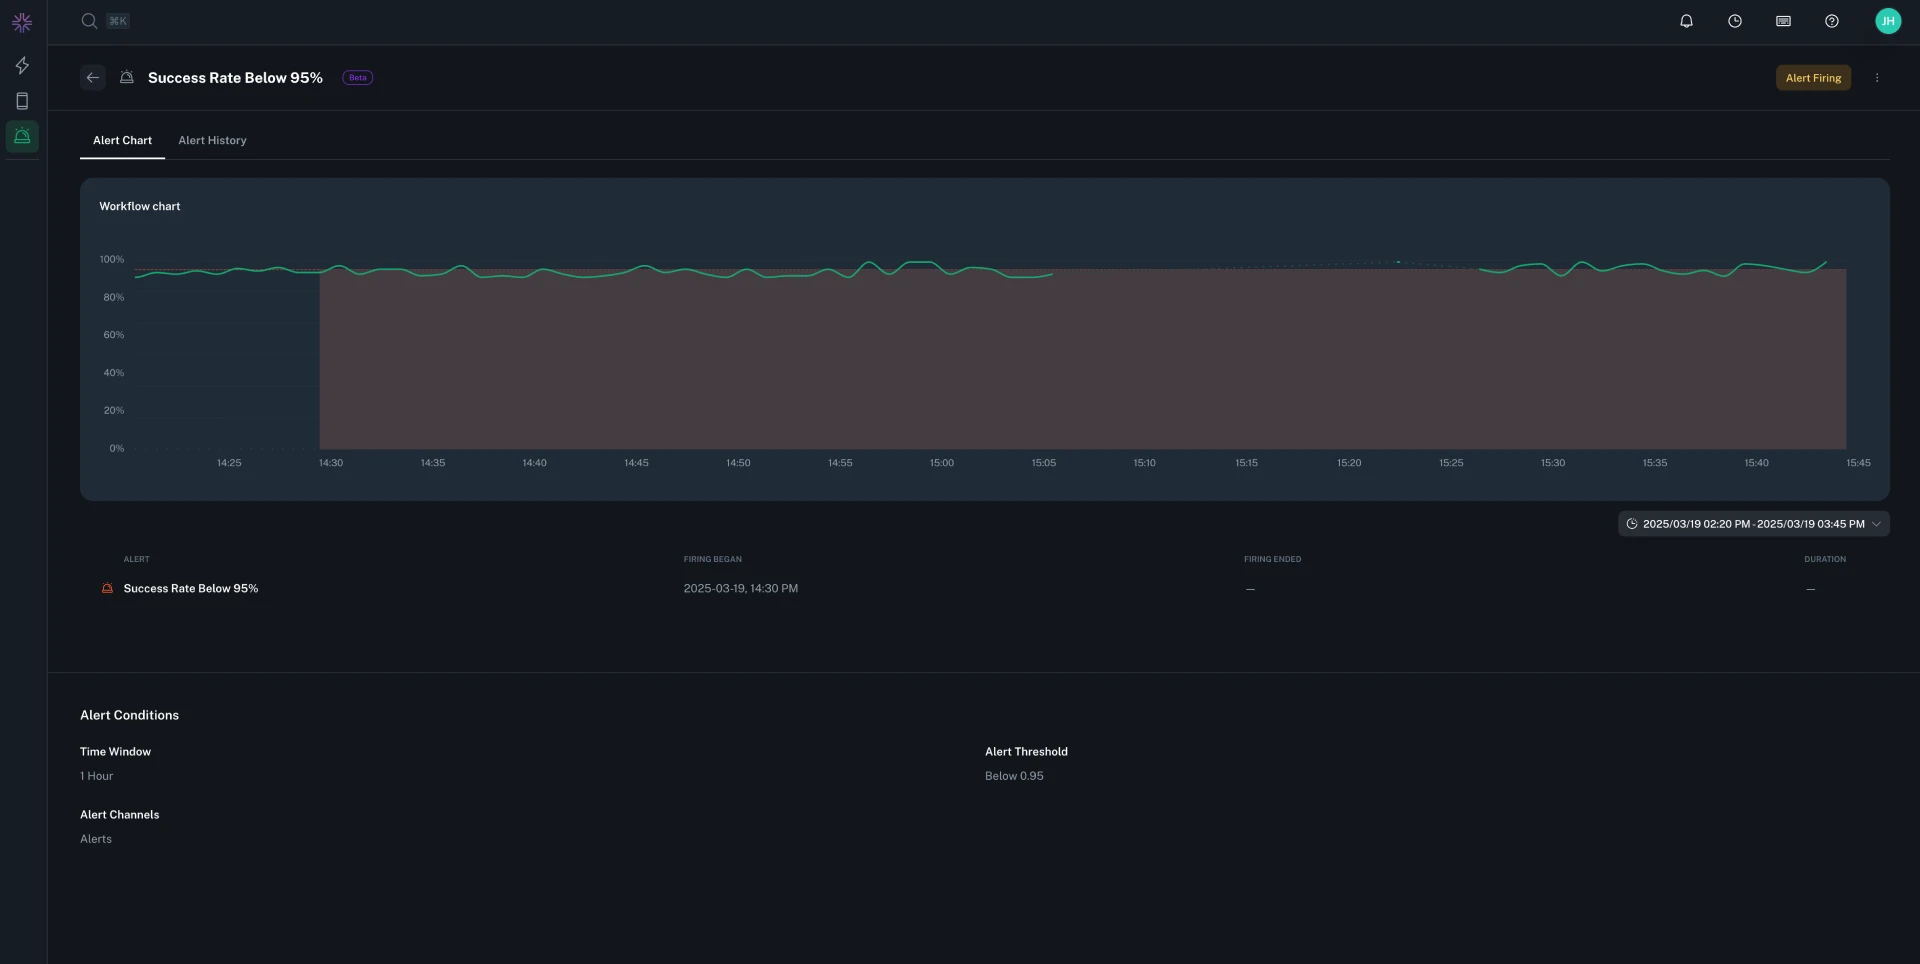
We've added a new alerting feature to help you monitor your Plot Chart actions and get notified when specific conditions are met. This feature is currently in beta, and we'd love to hear your feedback!
Nodes in the workflow editor will now show human-friendly labels for conditions, instead of raw values.
Nodes in the workflow editor will now show an improved layout for AND and OR conditions.
To make better use of screen real estate, the node library has been reworked as a floating toolbar. This allows for easier access to the node library, while maximizing visual space for workflows.
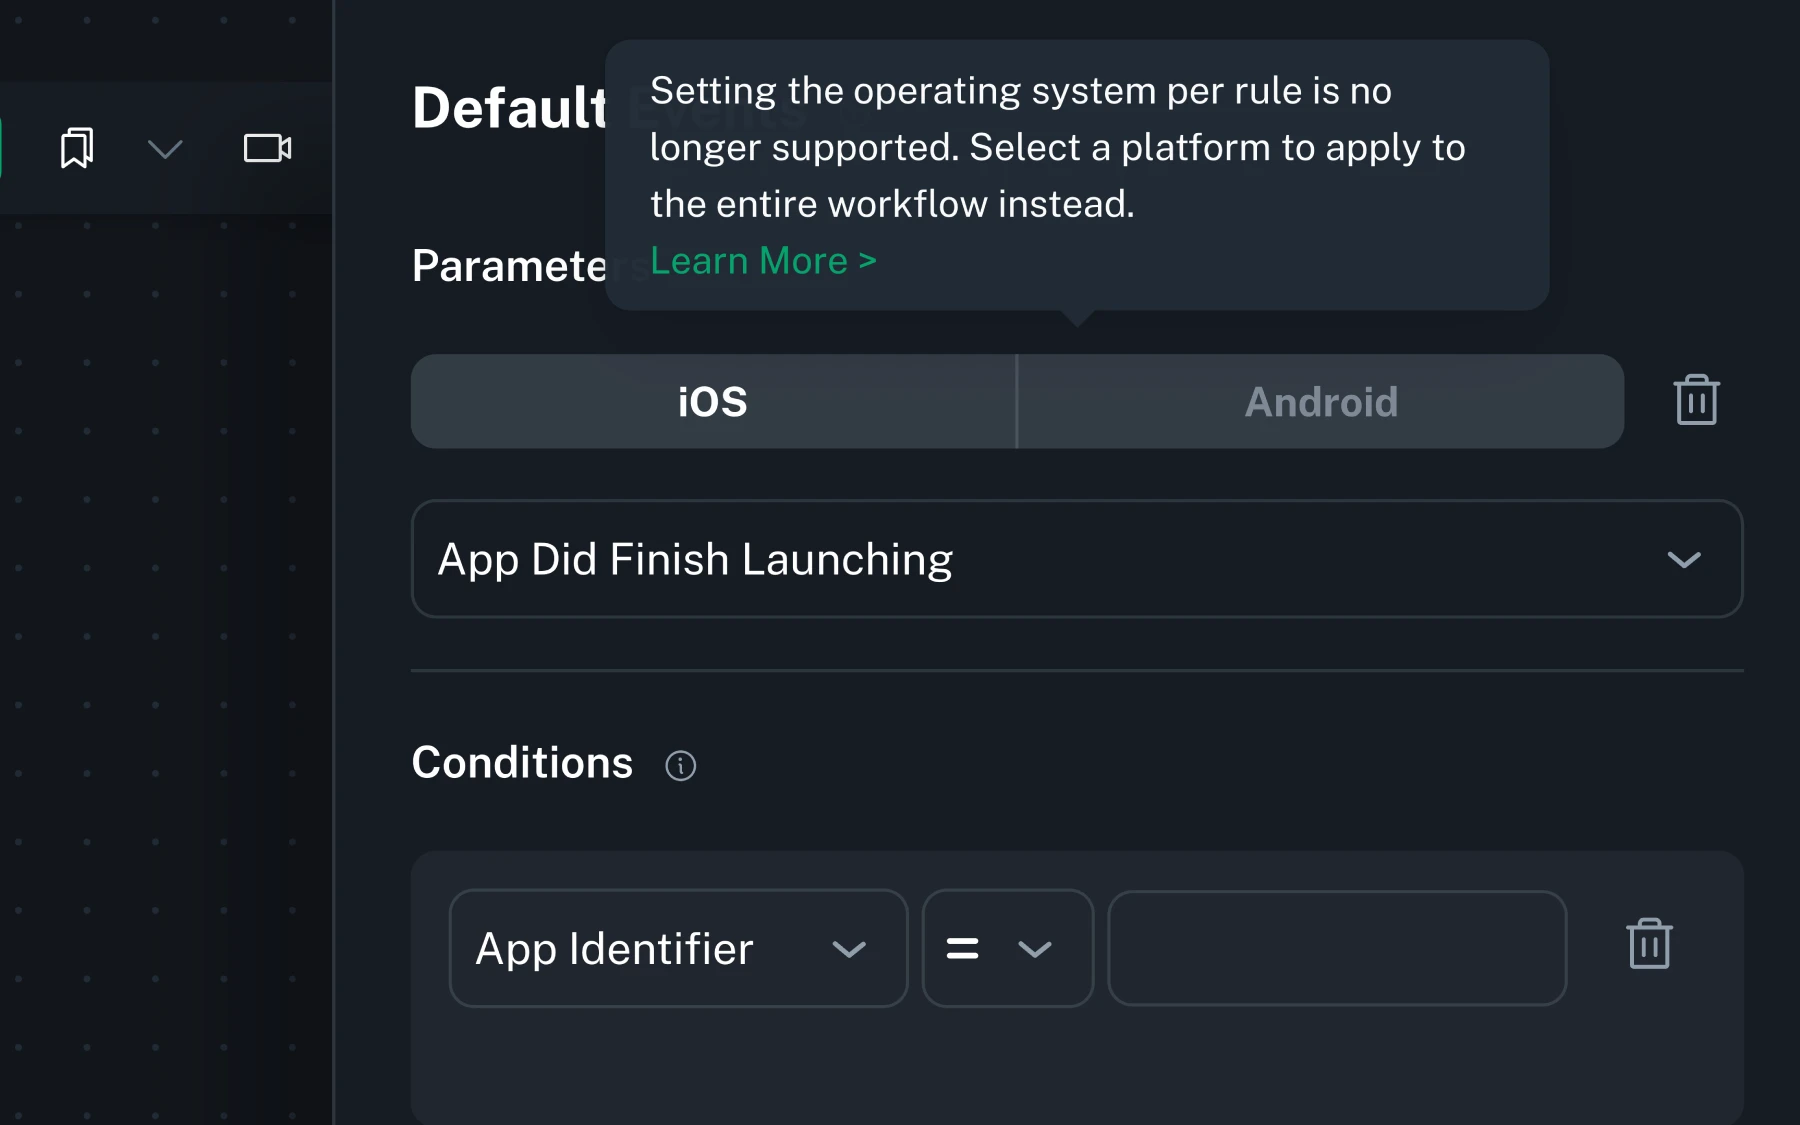
The Operating System parameter on Default Event or Generic Match rules has been deprecated, in favor of setting a target platform at the workflow level. Any existing rules with an Operating System set will continue to function as expected, but the value will no longer be changeable except for being removed entirely.
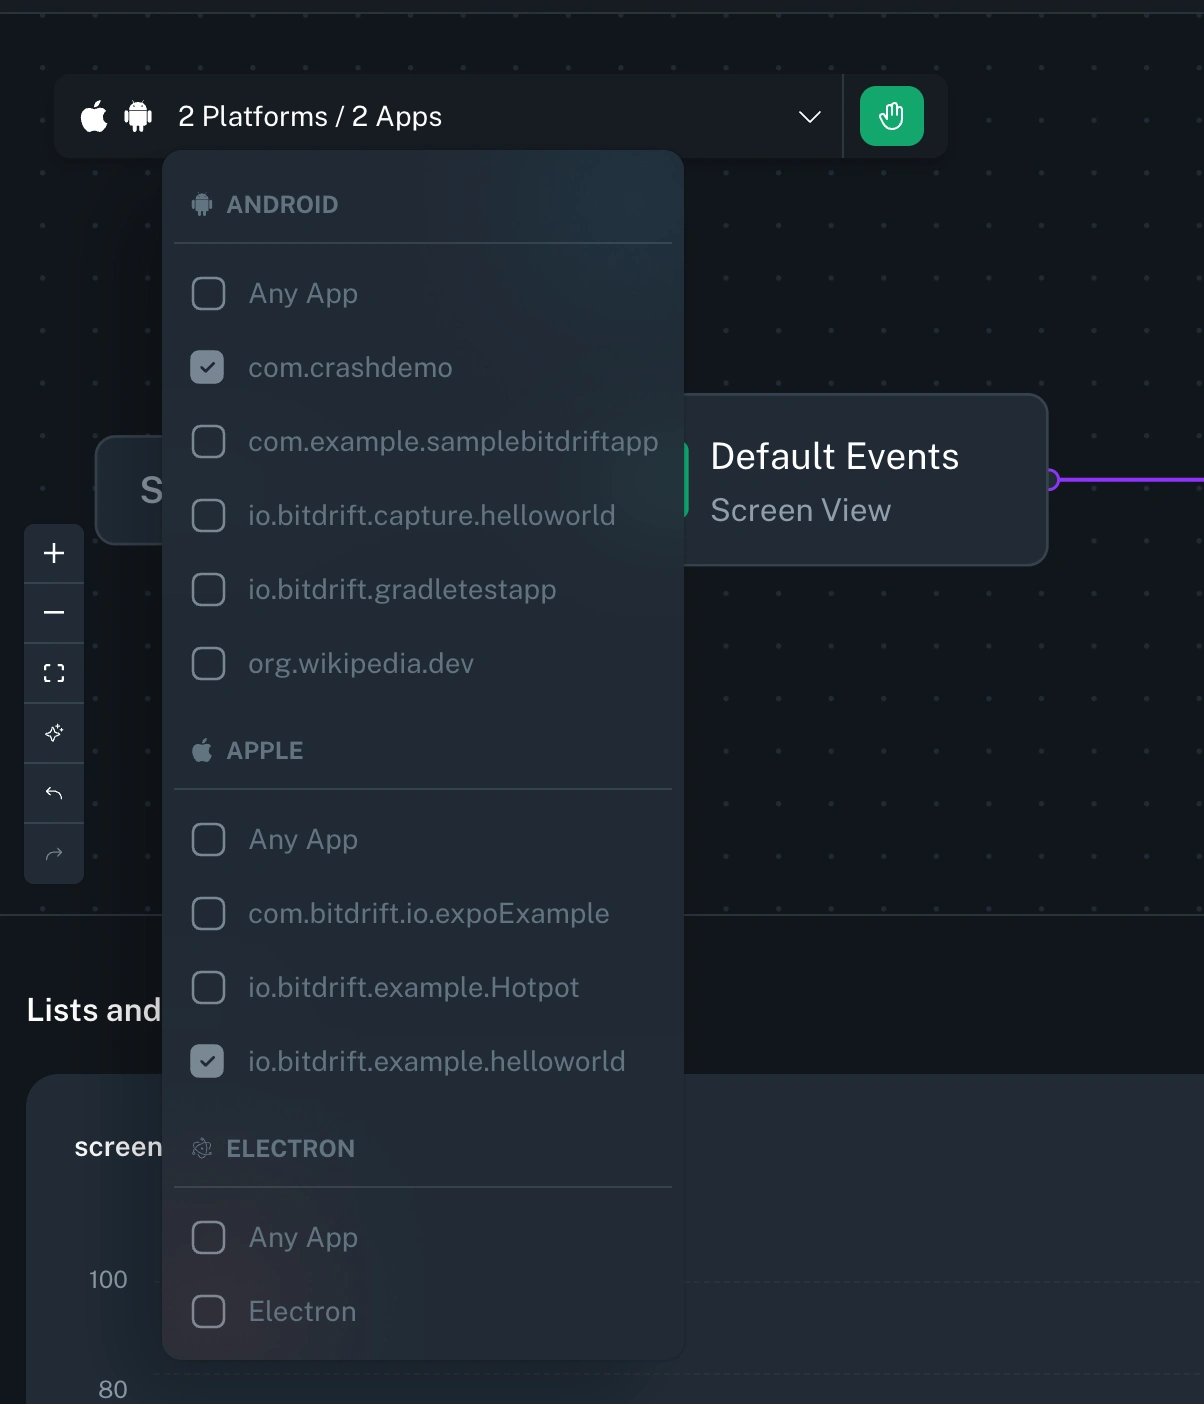
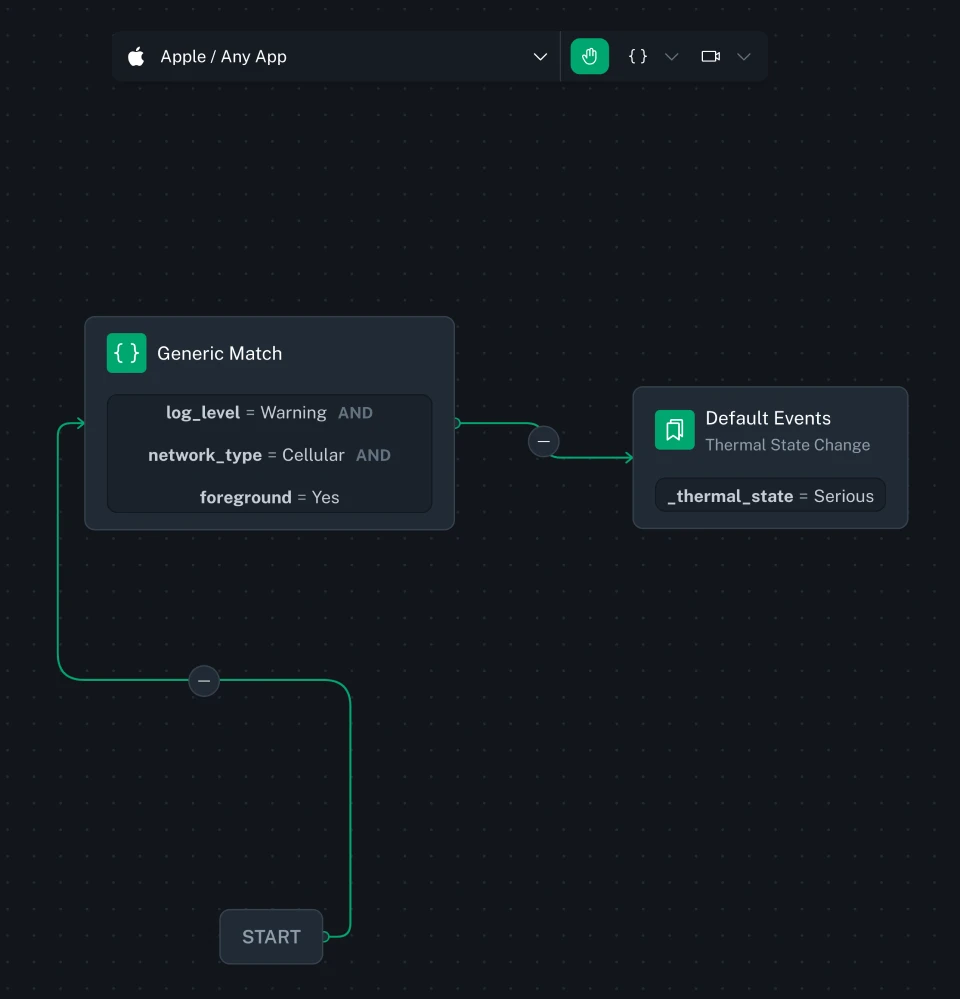
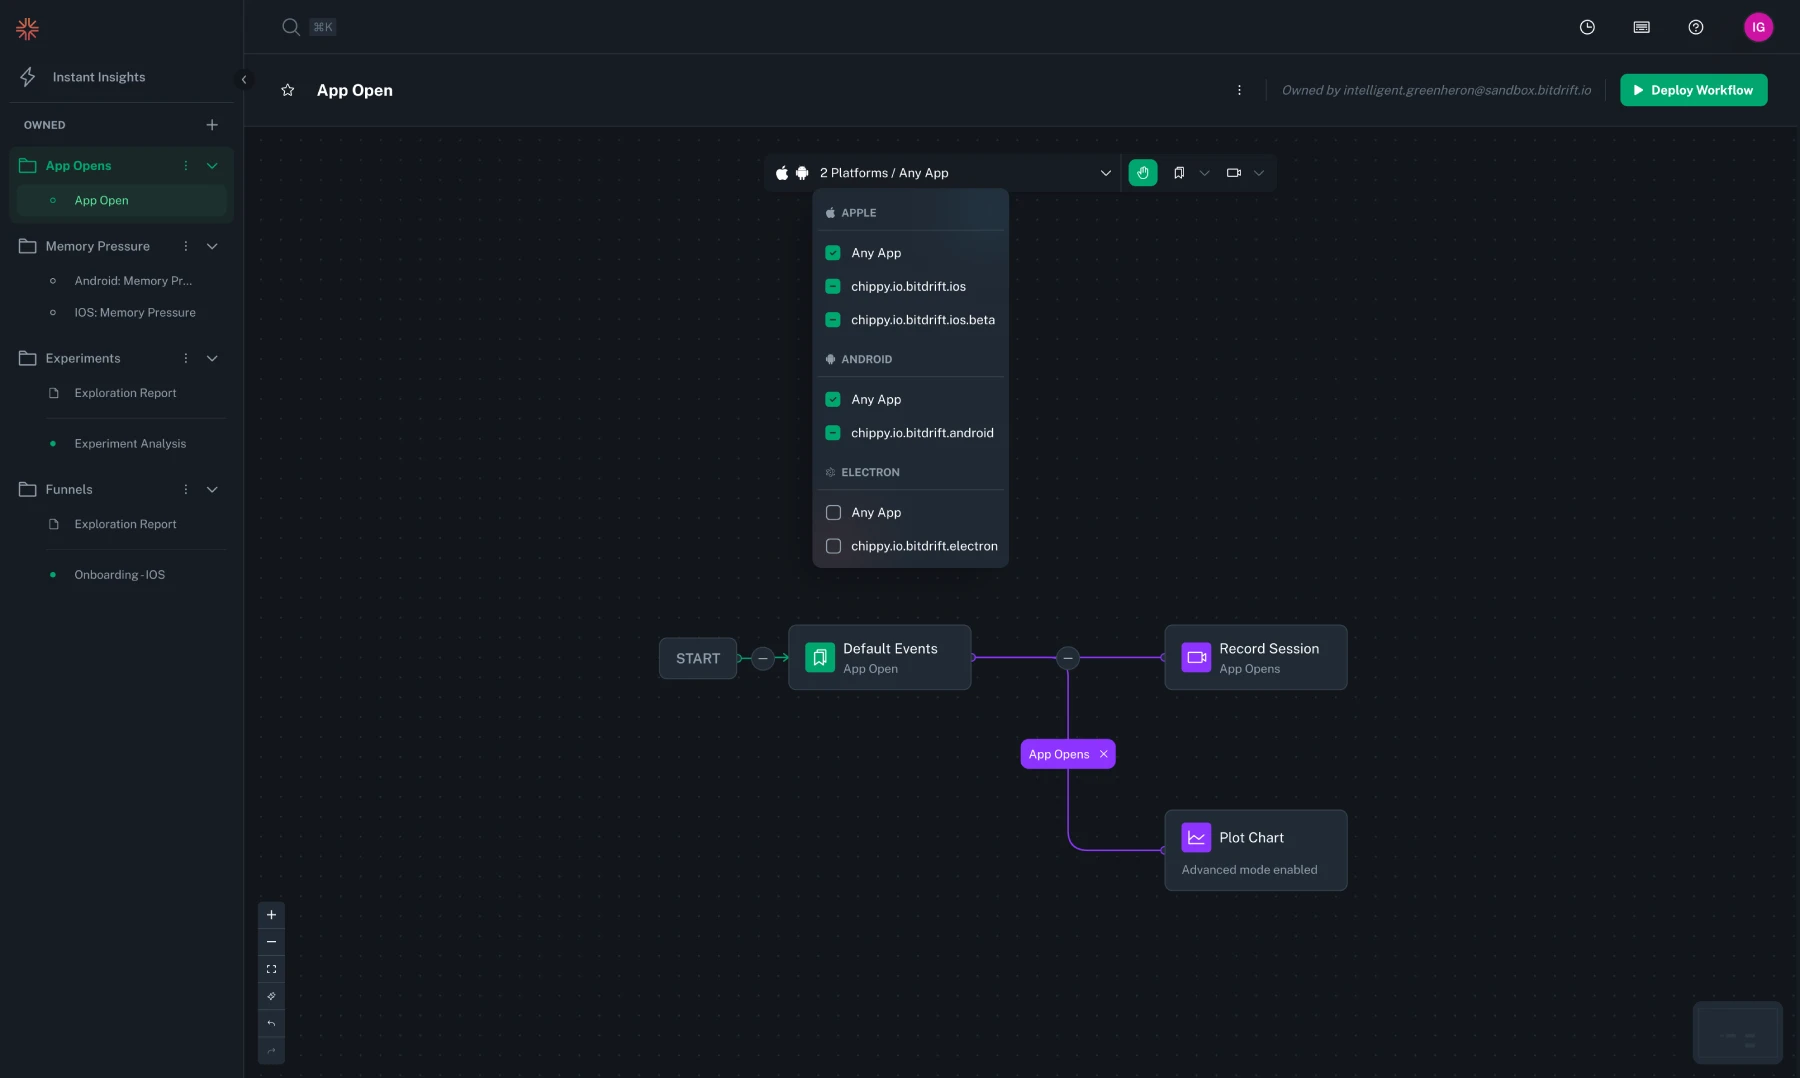
To better support Electron, Platform is now a first-class citizen in the workflow editor, allowing workflows to be created to target specific platforms and applications more easily and transparently. Supported platforms include Apple, Android, and Electron. This change also optimizes bandwidth by selectively sending workflows to only the platforms that they target.
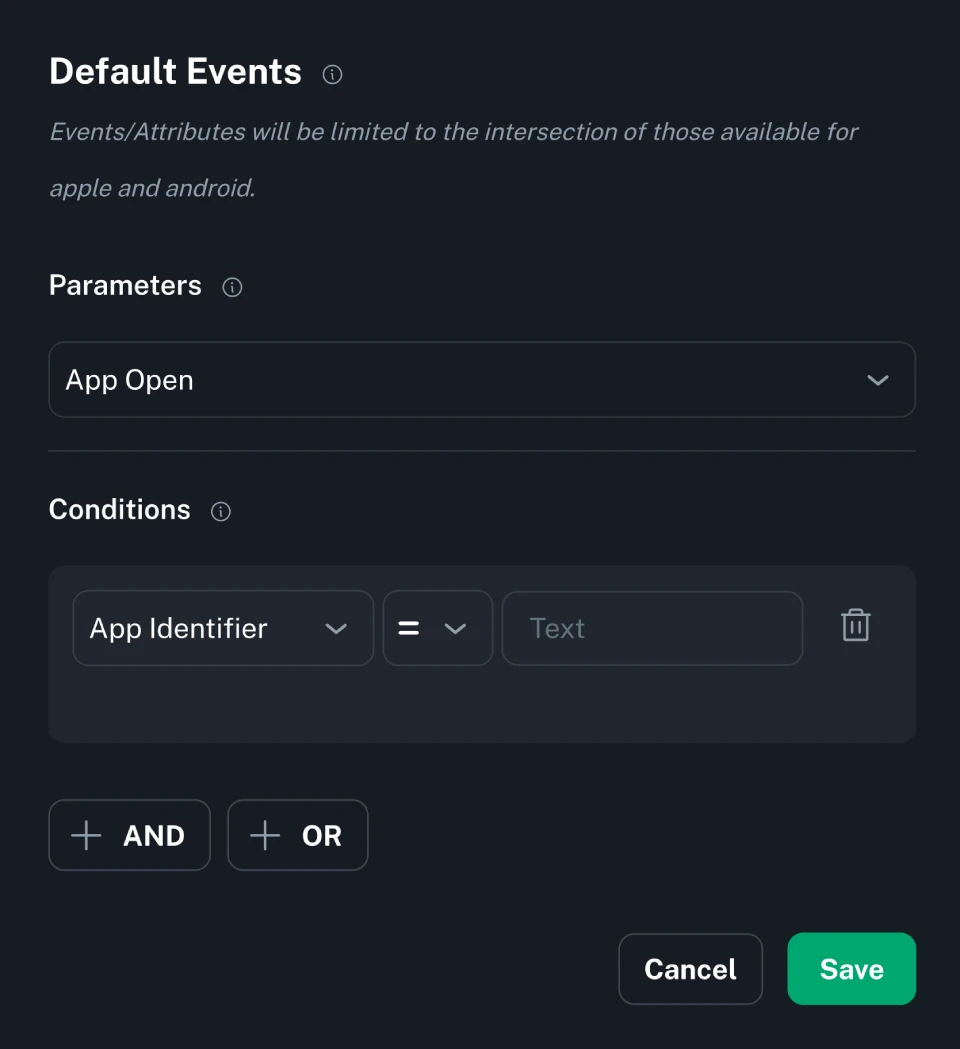
When targeting multiple different platforms, Default Event parameters will be automatically filtered to only allow for the selection of attributes common to all selected platforms. Ensuring a workflow isn't unintentionally narrowed to only match one of the selected platforms.
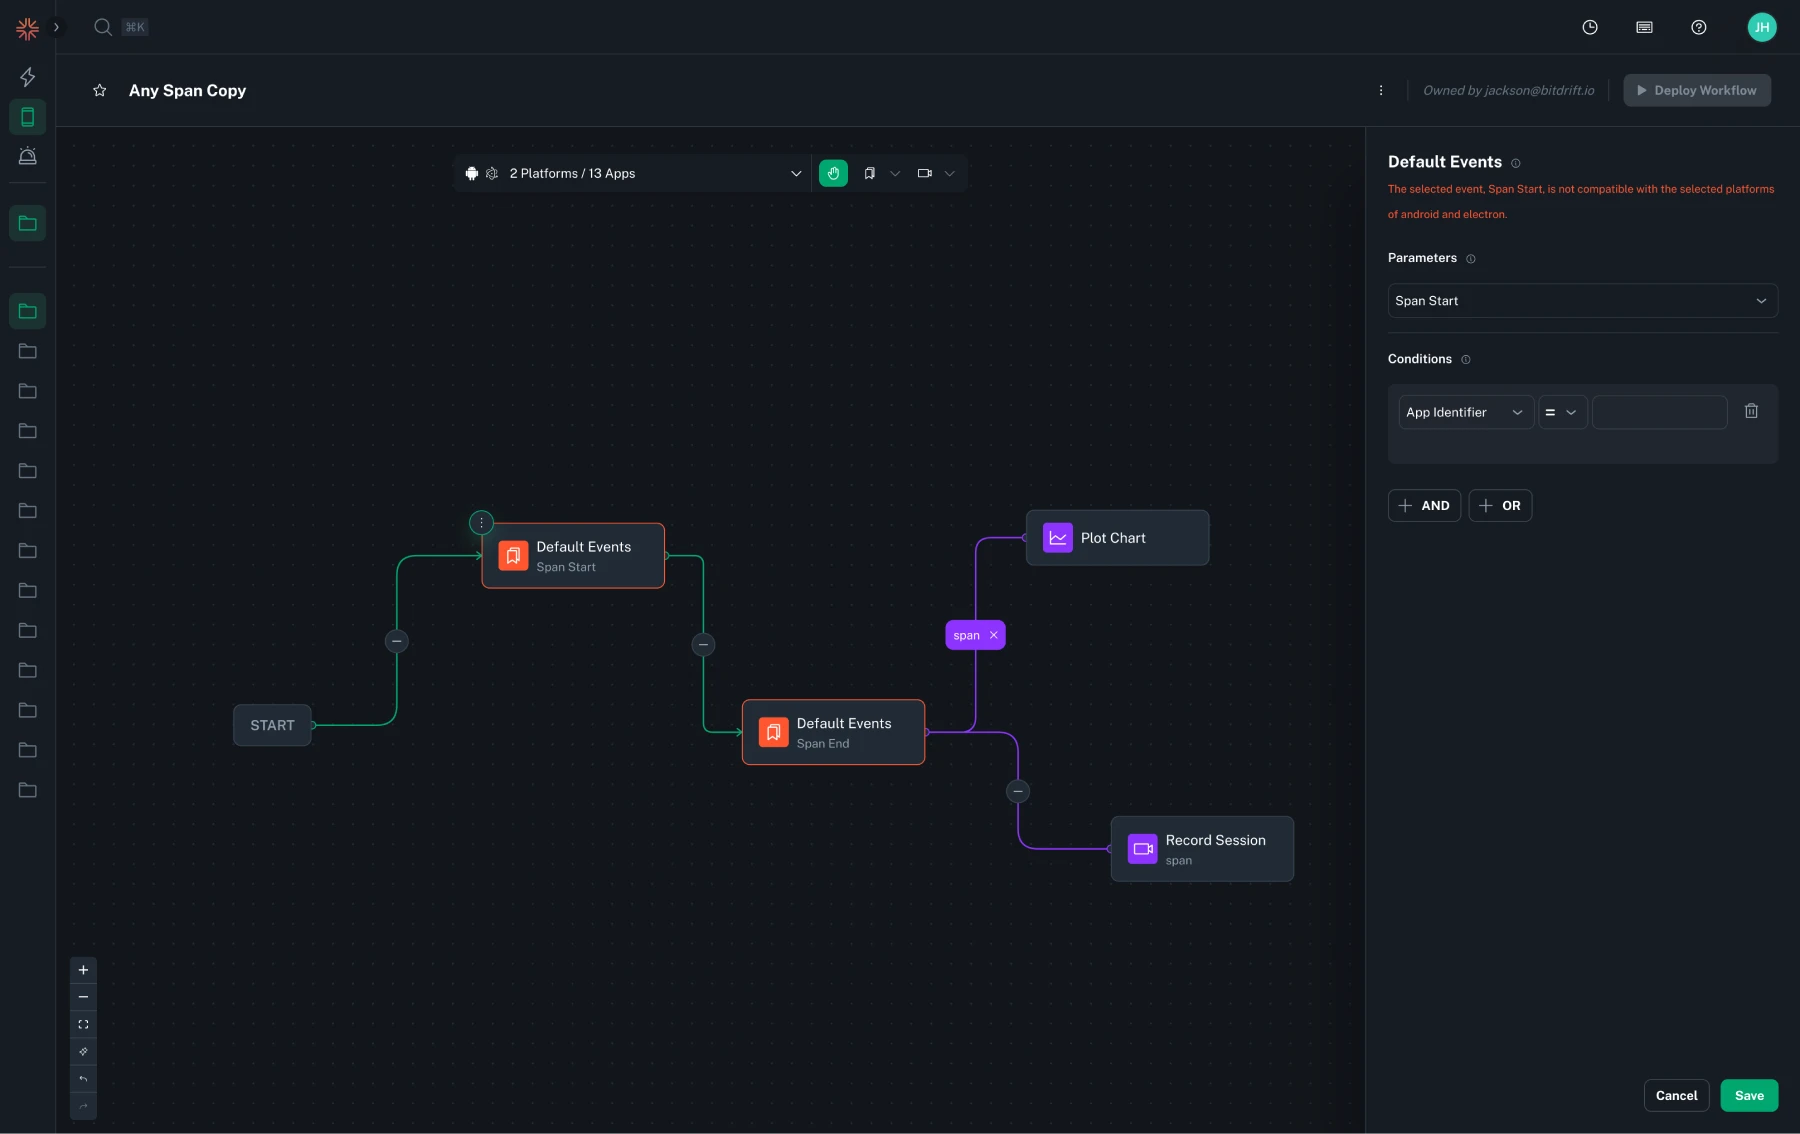
While editing a workflow, if a change in target platform will result in a Default Event parameter which doesn't match the new platform, the workflow will highlight the error, and deployment will be blocked until resolved.
Operating System is now an available condition on Default Event and Generic Match rules. This can also be used as a 'Group By' field in charts.
Resolved an issue where copying and pasting nodes with advanced charts did not retain all properties.
Adds a new page which offers a view of the outputs from all workflows contained within an exploration.
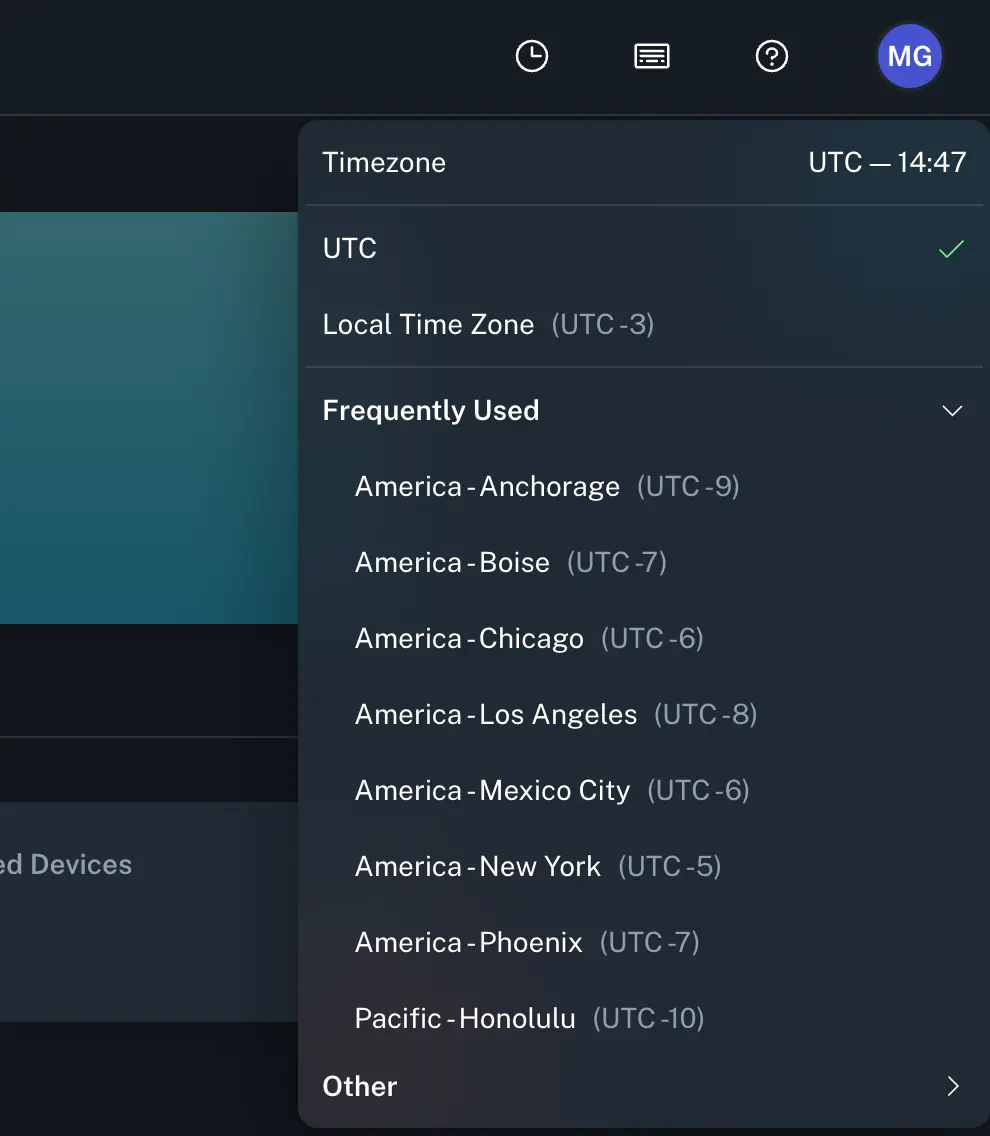
Access global timezone changes from the top nav bar, automatically updating timestamps across logs, charts, and reports
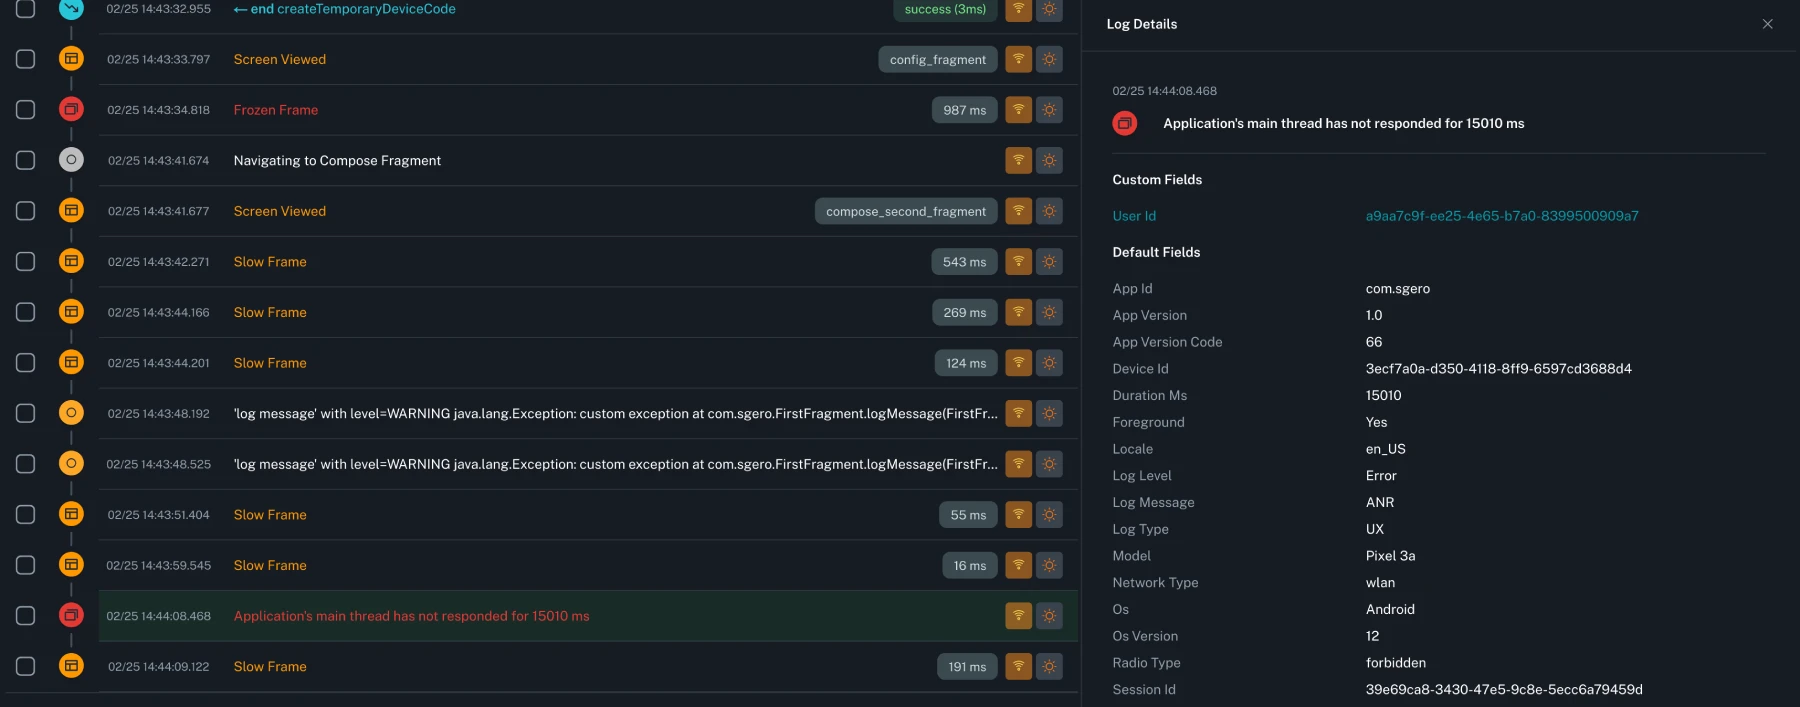
This update improves insights into dropped frames and non-terminal ANRs in timeline and explorations views.
Lowered the minimum zoom level to improve navigation for extensive workflows.
Adjusted padding to remove dead zones in the timezone selector.
Introduced a toggle button for high-contrast mode in blog pages.
Resolved an issue that caused unwanted horizontal scrolling on mobile screens.
Resolved an issue where the Sankey chart would break when expanded.
Introduced megabyte (MB) as a supported unit in relevant features.
This update includes additional memory-related attributes for app termination and crash reports.
Corrected an issue with the data retention constant affecting date range calculations.
Introduced a structured data processor to allow for Swift serialized objects to be rendered in the JSON viewer in timeline.
Addressed a type inference problem distinguishing between 1.0 and 1 as a match condition in explorations.
Expanded support to include a predefined list of Apple device types to convert Apple phone models to a human readable value.
Prevented keyboard shortcuts from interfering when typing in input fields or textareas.
Introduced an out-of-the-box log entry for 'Screen View' events.
Introduced a layout algorithm to automatically arrange workflows for better organization.
Corrected a minor syntax issue in tutorial content.
Adjusted z-index behavior to improve element layering with pinned tooltips.
Refined user experience and adjusted color schemes for UX actions in the timeline.
This update changes the default curve type to improved consistency in chart rendering.
This update expands HTTP method support to include all standard methods.
This update allows multiple dimensions to be used when comparing data in explorations.
This update resolves an issue affecting the visibility of the 'existing data' indicator.
This update ensures the cache is cleared when modifying the date range to prevent stale data.
This update removes immutability constraints on polling requests to improve data fetching.
Initial loading of session timelines from cold storage is now 10-100x faster. Vroom.
This update adds the PATCH method as an option in the method dropdown.
This update resolves an issue where events were not displaying correctly.
GraphQL matchers are now visible and functional for iOS platforms.
This update resolves an issue where the platform icon was not displaying correctly.
This update changes the curve type for aggregated insights charts to monotoneX, improving the visual smoothness of data representation.
This update relocates the date picker to the workflow output control bar for better accessibility. Date range changes now apply to Flush rule outputs.
This update introduces a helper in the top nav for viewing available keyboard shortcuts, making navigation and interactions more efficient.
This update enhances workflow builder functionality by enabling support for matching GraphQL operations.
This update introduces navigation controls in the timeline view, allowing users to seamlessly move between adjacent sessions for improved workflow and analysis.
This update enhances the efficiency of Sankey chart rendering, reducing lag and improving responsiveness, particularly for large datasets.
Fixed a bug that caused advanced chart actions to be created series containing different chart types.
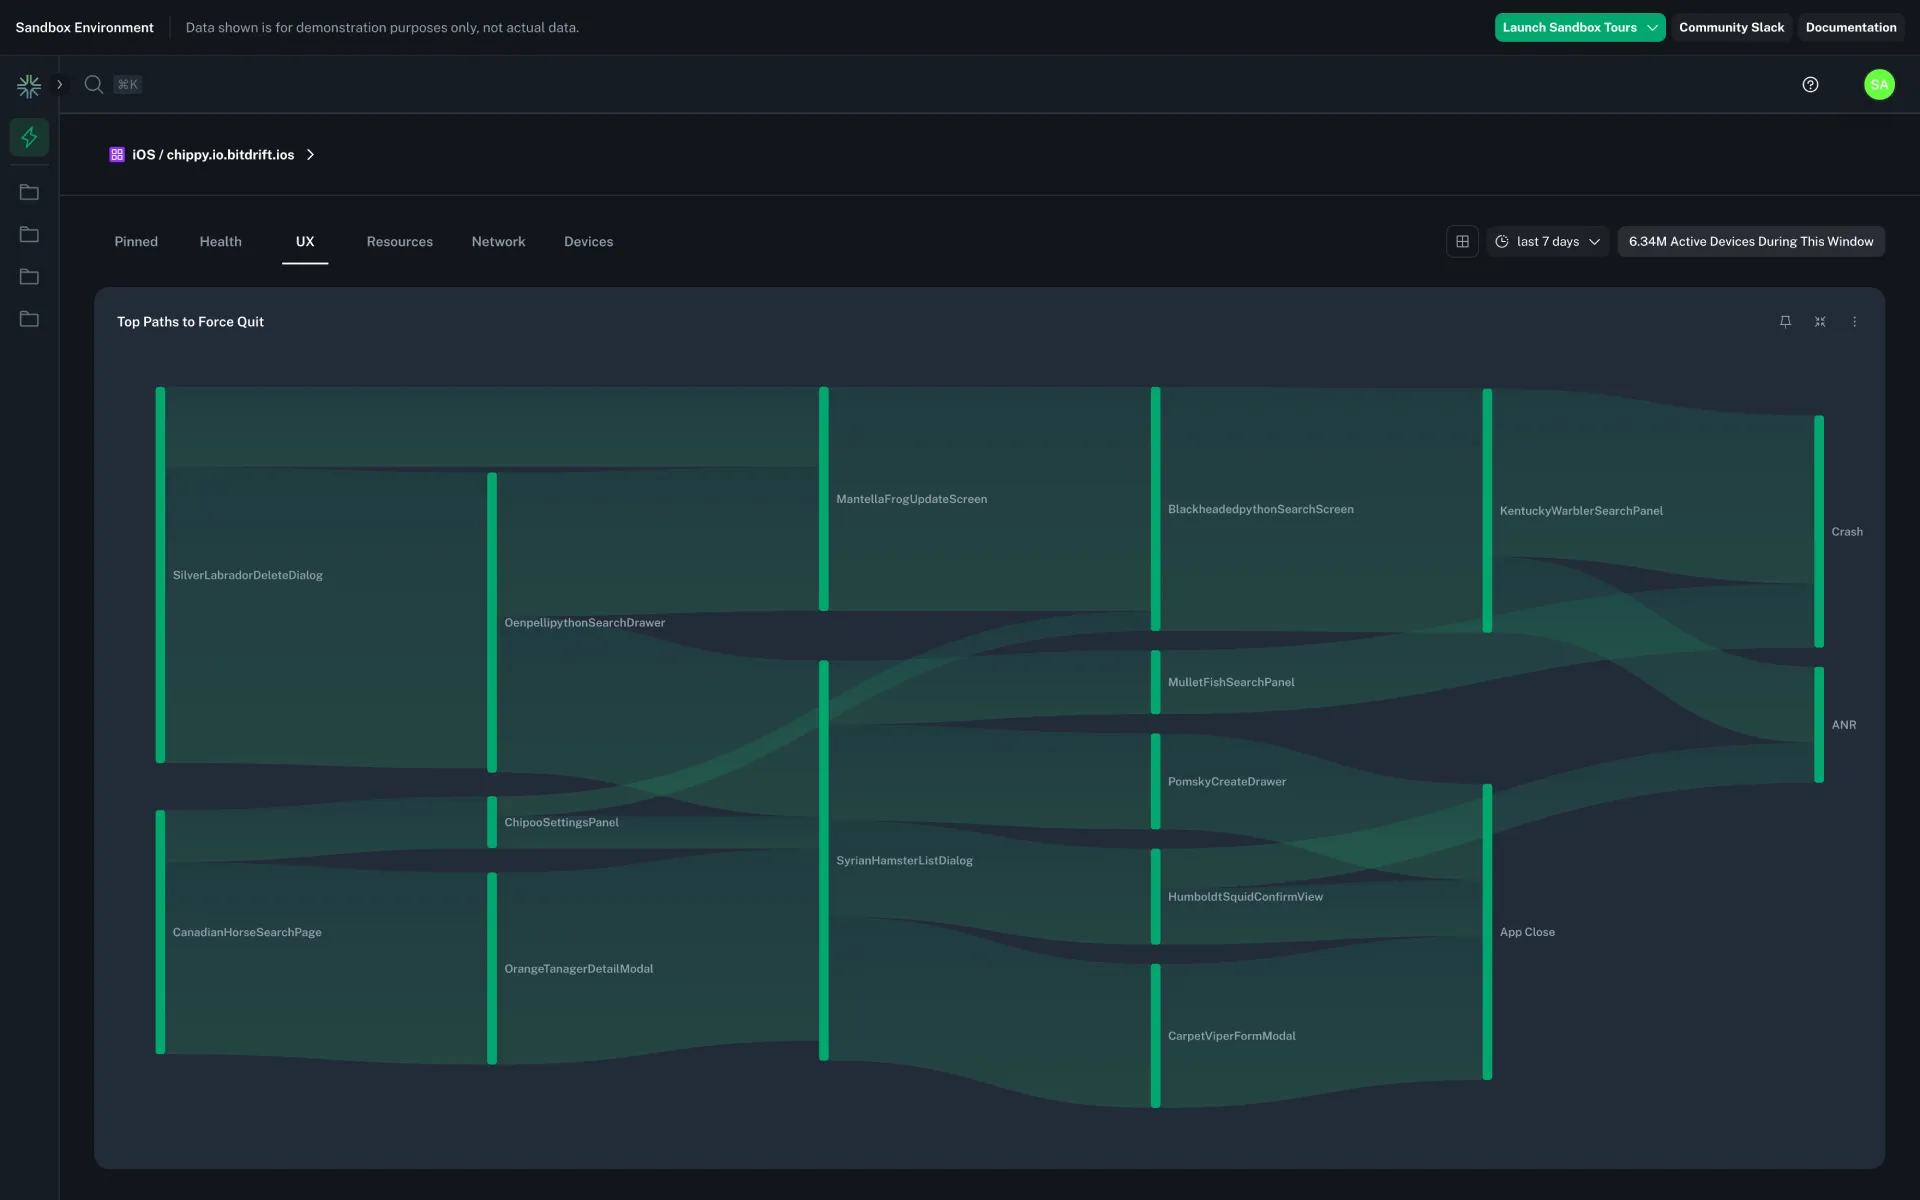
Enabled the new Create Sankey action, to allow for workflows to be built that will show a user journey. More details can be found in the docs.
Added the ability to compare and filter by app version in the Instant Insights page. This allows you to compare the performance of different app versions side-by-side, and filter the data to only show a specific version.
Fixed a bug where the workflow editor would crash when attempting to select a known app version or id for a new customer with limited data.
Fixed a bug which allowed 'data segmentation' to be flagged for unsupported chart types. The result of this flag being set meant that aggregated insights would not load properly, and would sometimes crash the page.
Added the ability to group by device model on Plot Chart actions.
Added the ability to release ownership of a workflow, as well as the ability for a user to assume ownership of a currently unowned workflow.
Improved the interpolation of log fields into timeline row tags so gracefully handle unexpectedly missing properties.
Fixed the onboarding tutorial to use the up to date initialization method.
Fixed a bug where the list of known app versions were truncated in a way that made it difficult to select a specific version.
Fixed a bug where the tooltip marker on line charts would sometimes not align with the correct data point.
When configuring conditions containing an App Identifier or App Version within a Default Event or Generic Match matcher, you'll know be able to select from a list of known apps and/or versions. If the condition contains both app id and app version, the suggestions for version will be scoped to the selected app id. Custom entry is still supported.
Added the ability to move non-deployed workflows between explorations.
Tags which render a duration in milliseconds will now round to 1 decimal place when necessary.
The tag for a failed Network Response will now show the status code.
Fixed a bug where common attributes were missing as condition options for Network Response matchers.
Fixed a several miscellaneous bugs. Also added a 'opened' state to nodes in the workflow editor to easily identify which node the drawer is configuring.
Fixed a bug where the Instant Insights page would periodically 'flicker'.
Changed the layout of the explorations table on the home page to provide a link to the workflow instead of triggering a JavaScript navigation.
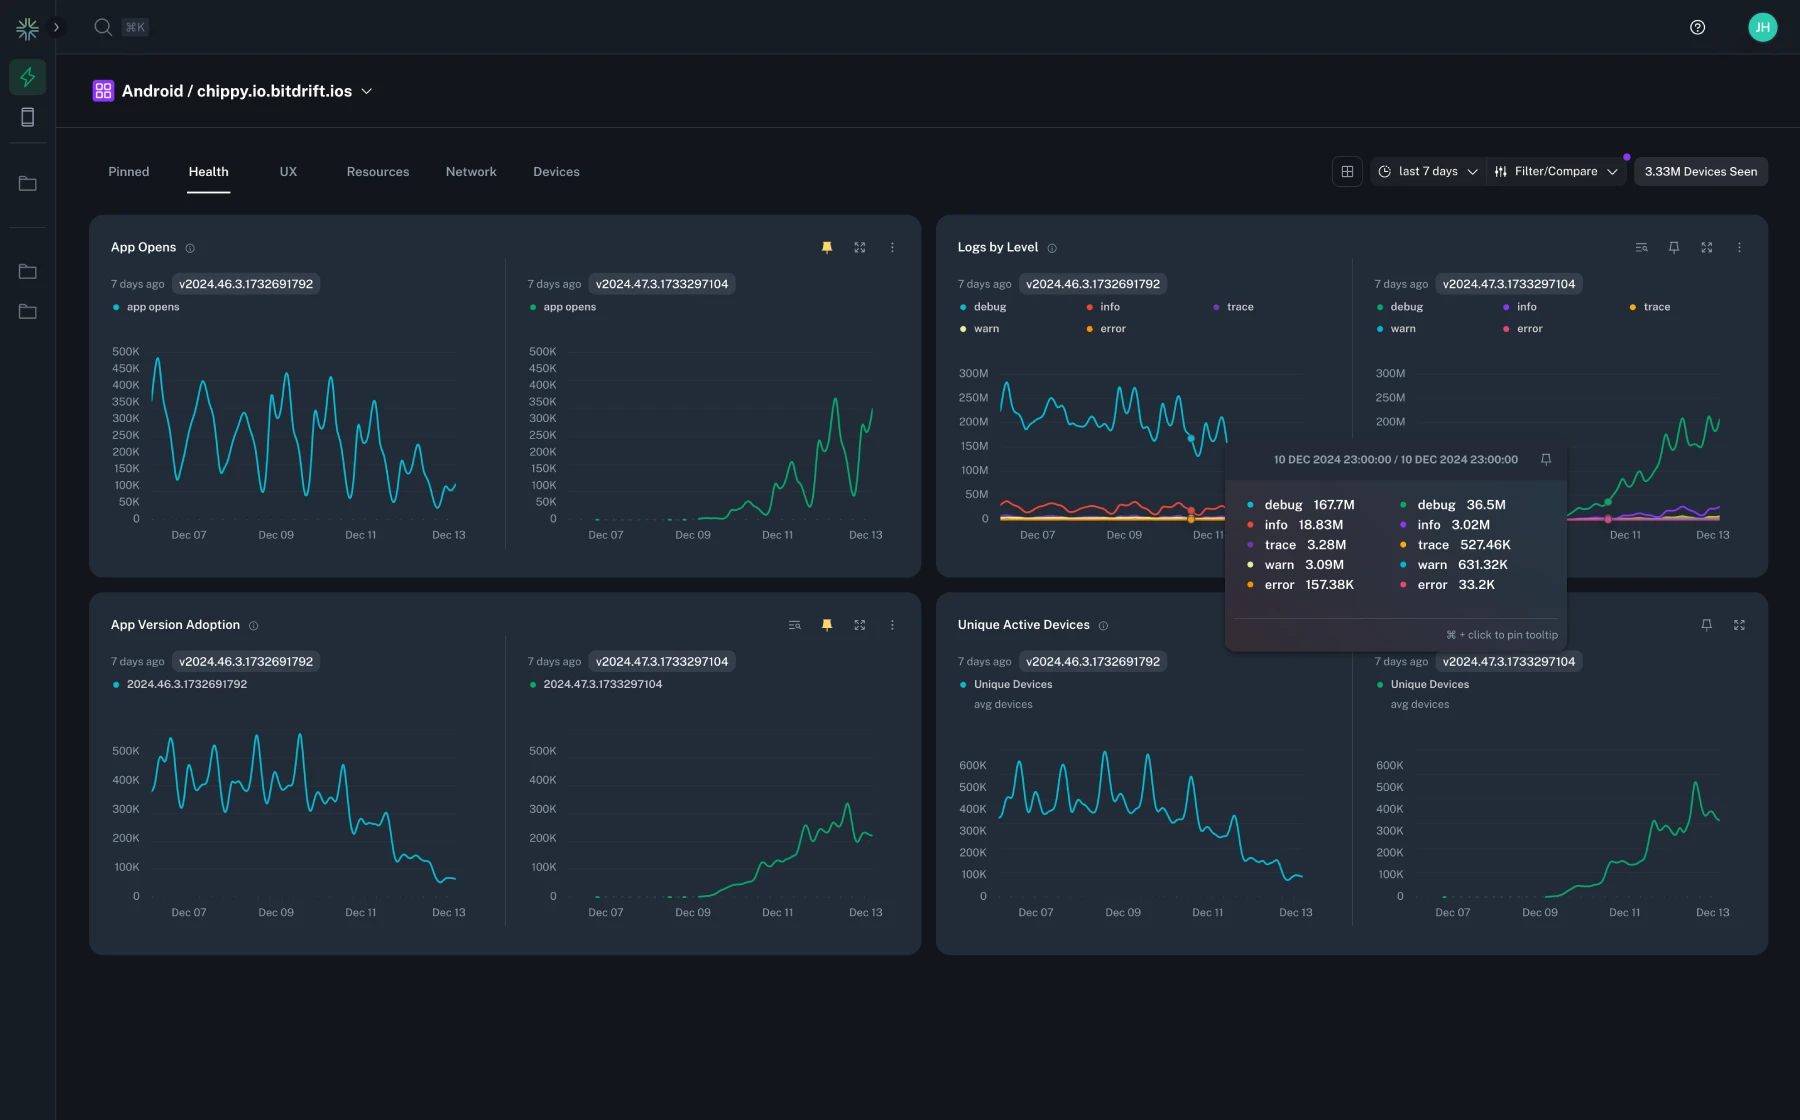
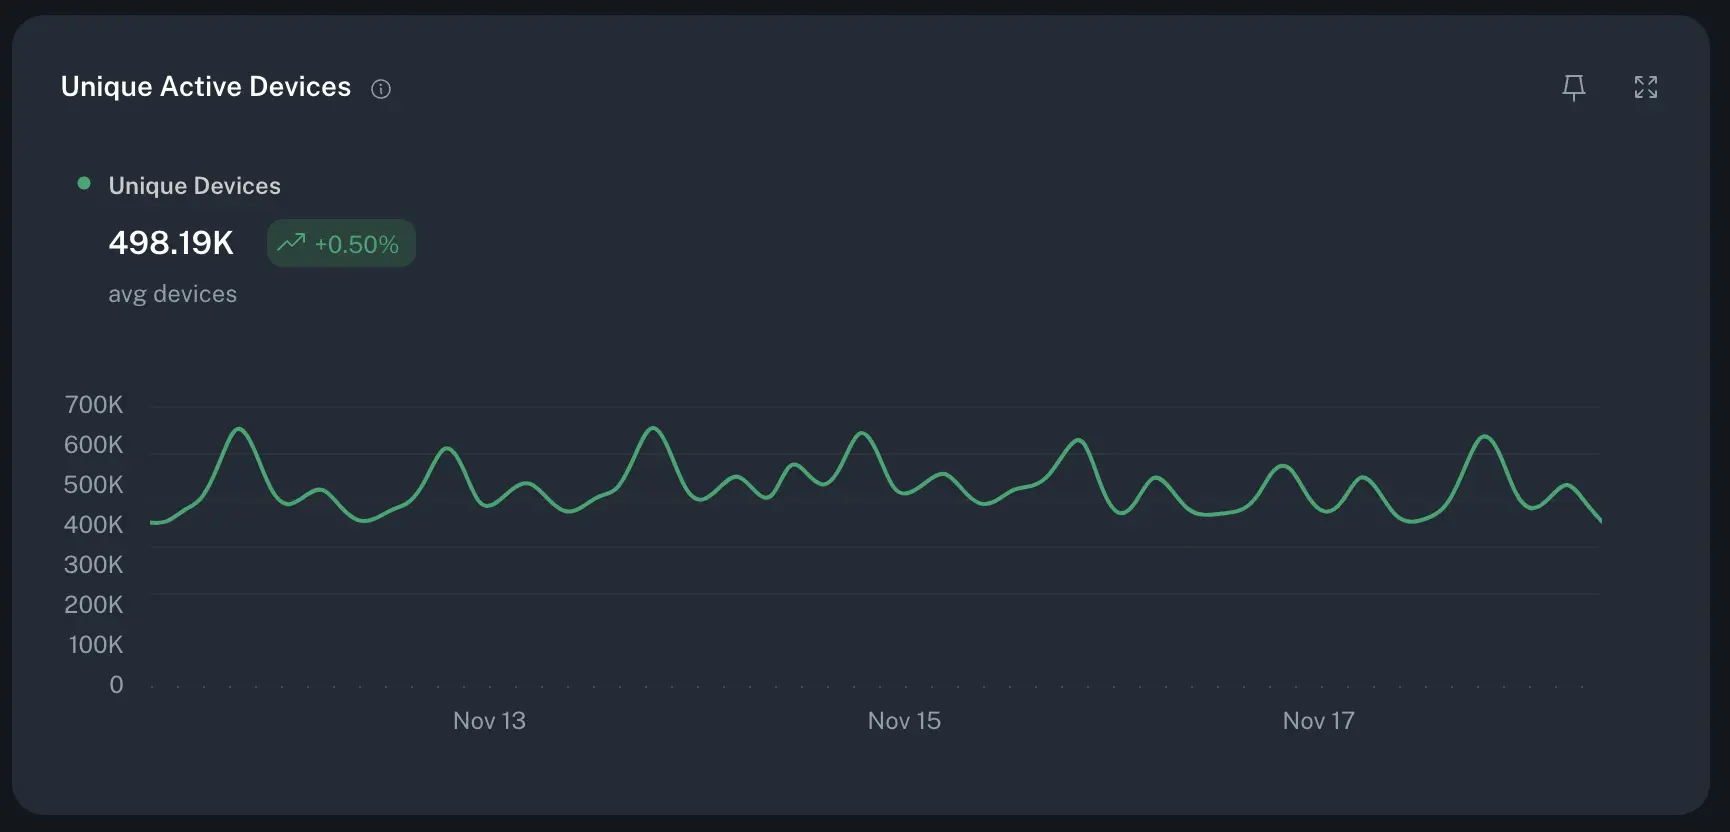
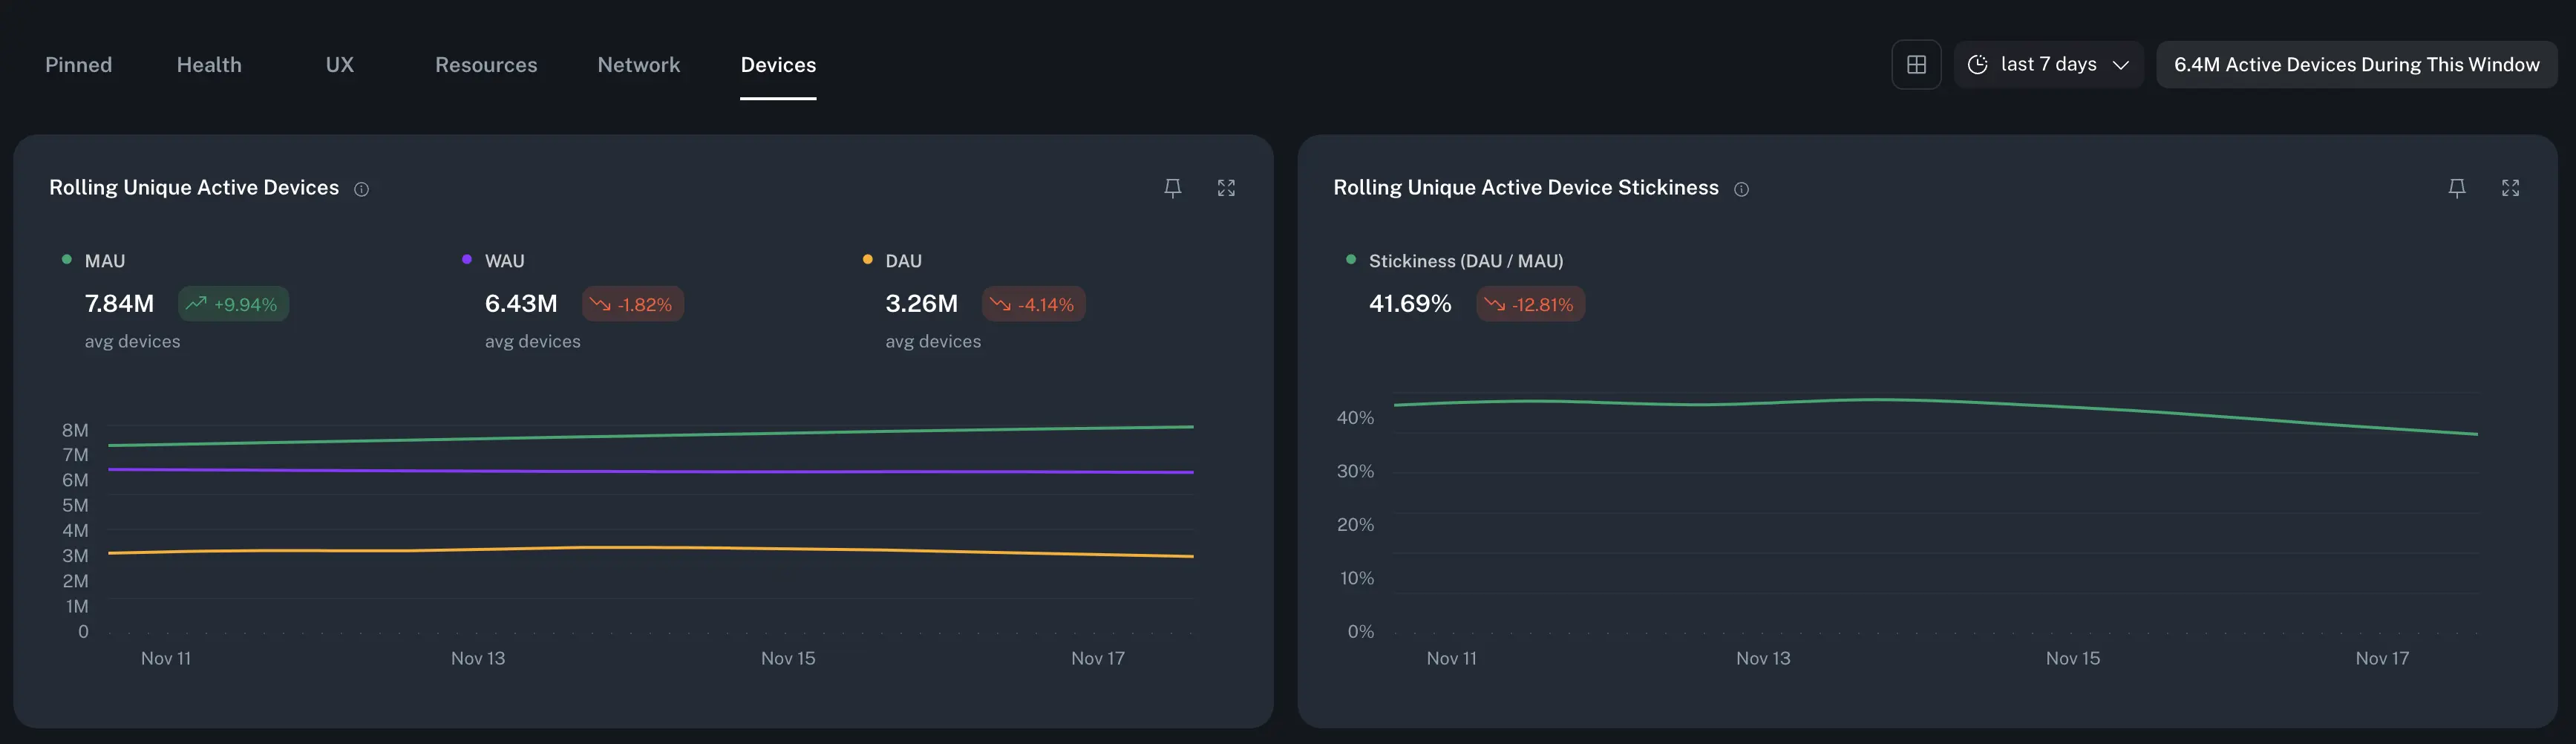
Added new charts tracking active devices in Instant Insights.
Over the selected time frame, plots the unique active devices, shows the average over the time range, and the rate of change from the beginning to the end of the selected time range.
Contains two charts: Rolling Unique Active Devices and Rolling Unique Active Device Stickiness. The former shows a rolling window of the average over the previous 30, 7, and 1 days. The latter shows the stickiness of unique devices i.e. the percentage of devices which are active monthly vs daily.
Updated the workflow editor to use a drawer for modifying individual node attributes. Previously this was a modal that would obscure the rest of the workflow.
Added improved keyboard navigation to the timeline. w/s or k/j will now navigate up and down the timeline rows, and a/d or h/l will collapse/expand the row metadata. When the metadata panel is open when navigating up/down, it will update to show the metadata for the new selected row.
Within the 'Session Replay' tab a/d or h/l will navigate backwards and forwards through the distinct replay screens.
More on this to come...
Contributed upstream to airbnb/visx to add support for Sankey Visualizations.
Added example sankey chart to Instant Insights in the sandbox.
Added support for matching on poor network quality in workflows. Within the timeline, logs which show poor network quality will be highlighted relative to surrounding logs, and show an update network status icon.
Fixed a bug resulting a content shift within the expanded log details panel when hovering over the log metadata field name.
Added the ability to drill down into additional dimensions when viewing a chart with a 'Group By' field selected. This allows you to view the data for a specific dimension within the selected group, that normally would be aggregated into the 'Other' series.
Clicking on timeline row tags will down automatically copy the tag content to your clipboard. In addition to this, ctrl/cmd + click on the row itself will copy the timestamp, message, and tags to clipboard.
Added warnings when any rule conditions with text entry contain leading, trailing, or additional whitespace. Rule nodes which have conditions with extra whitespace will also show a warning icon in the workflow editor.
Fixed several broken links to docs.bitdrift.io.
Fixed a visual bug which resulted in the overflow gradient applied to timeline row tags didn't match the row background.
Made several changes under the hood to improve the performance of the timeline when expanding/collapsing row metadata.
Renamed the 'SDK Configured' log event to 'SDK Started' for better consistency with the mobile SDK naming conventions.
For any inactive workflows with a Record Session action, we'll now dynamically detect whether there is already captured data available for that workflow. If so, that data can be displayed without having to deploy the workflow.
Fixed a bug where the sum of displayed time series data would not be calculated correctly streaming live data.
A new sandbox environment is now available for Instant Insights to allow you to try out the feature without any setup.

Fixed a bug where rate charts with values smaller that 0.01 would result in a chart with a very large y-axis range.
Updated the logic determining the accuracy of x-axis labels for time series charts, based on selected time range.
Added App Launch TTI Capture SDK out-of-the-box log event with an option for workflows to match on it.
These operators allow you to filter log events based on the presence or absence of a field. For example, you can now filter for all network requests that have a User-Agent header set.
Added query attribute matching condition to out-of-the-box Network Request and Network Response matchers.
Added iOS Application Not Responding (ANR) Capture SDK out-of-the-box log event with an option for workflows to match on it.
Added Thermal State Changed Capture SDK out-of-the-box log event with an option for workflows to match on it. The event contains information about current device's thermal state.
Added an option to match on and group by Error Type attribute of Android network response log events.
Fixed a bug in the timeline where the side panel layout would break for Chrome/Firefox when viewing very large captured sessions.
Added SDK Version attribute to capture the out-of-the-box SDK Configured event.
Fixed a bug where captured sessions which were still ongoing could error out when loading within the timeline.
Added App Update Capture SDK out-of-the-box log event with an option for workflows to match on it. The event contains the information about the application installation size.
Added SDK Configured Capture SDK out-of-the-box log event with an option for workflows to match on it.
Added App Termination Capture SDK out-of-the-box log event with an option for workflows to match on it. Emitted by Android SDK only.
Added an option to match on existing Session Replay Capture SDK out-of-the-box log event.
Added disk usage attributes to Resource Utilization Capture SDK out-of-the-box log event with an option to match on and visualize application disk usage using Resource Utilization
Added an option to match on App Version Code attribute on iOS and App Build Number on Android.
Added ability to filter the timeline results by a search term.
Added an option for workflows to match on newly added 'App Update' Capture SDK out-of-the-box event.
Fixed a bug where non-advanced line charts would not load in the sandbox environment.
Fixed a bug where the first log in a session would be missing from the Timeline.
Fixed a bug where changing from a fixed time range to a relative time range would render incorrect chart domains.
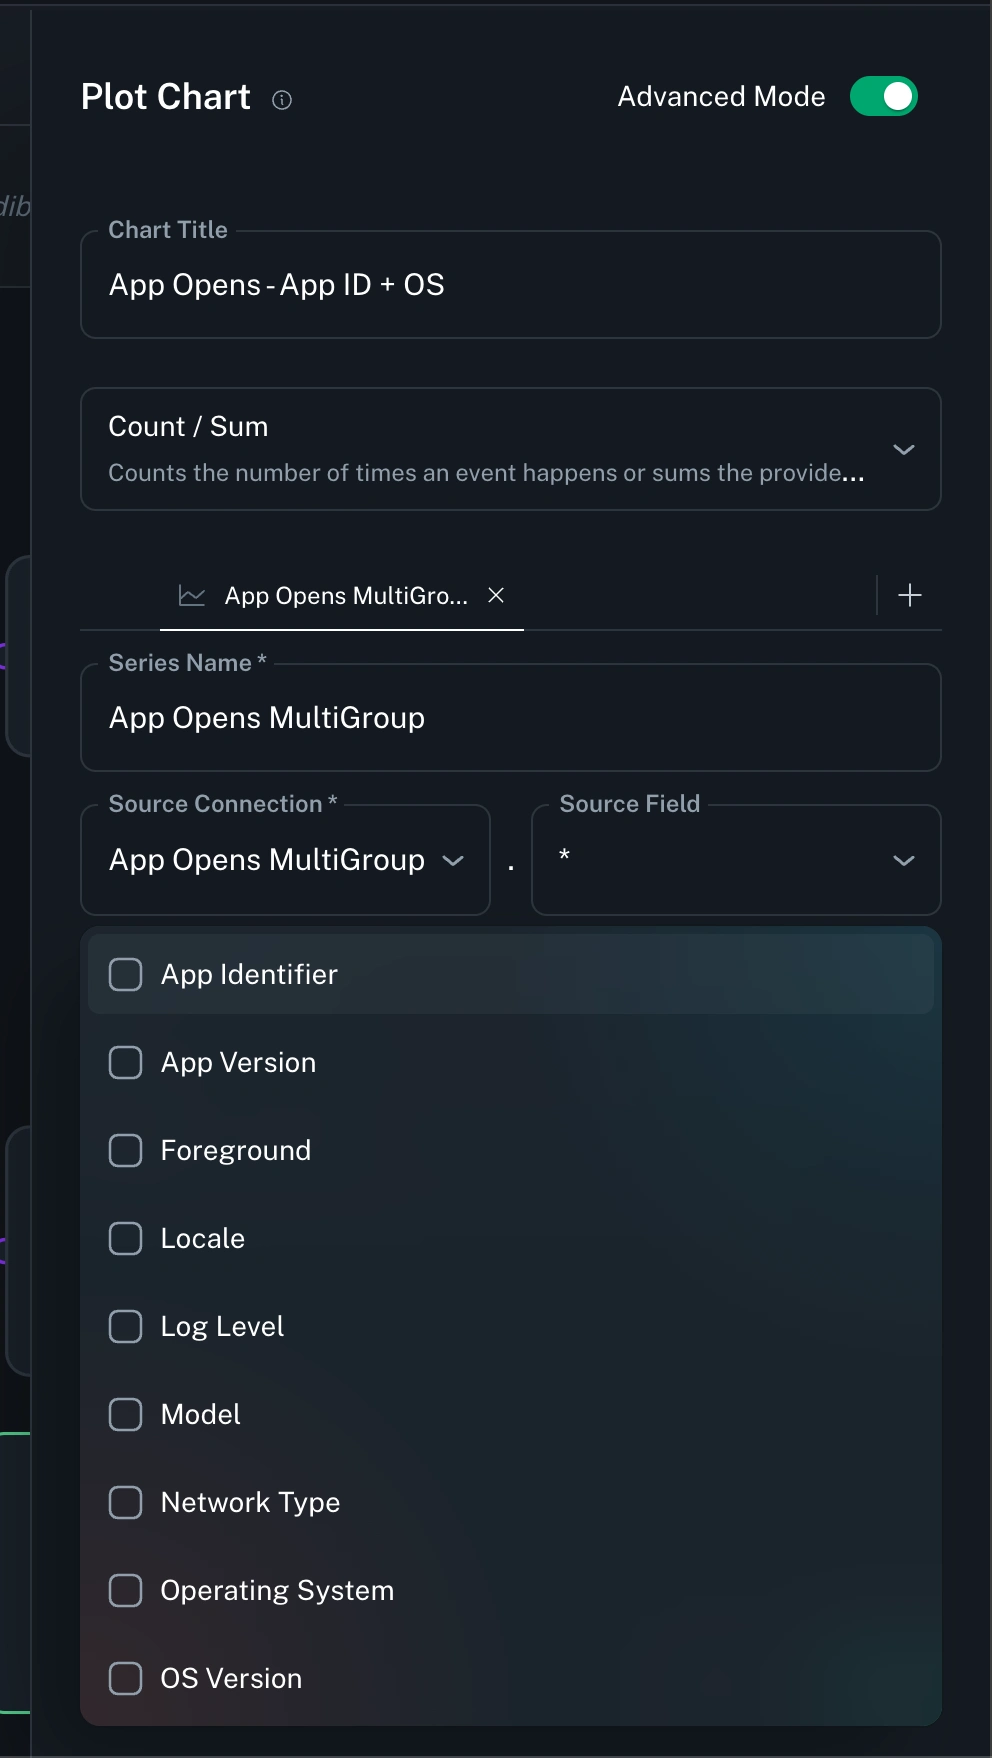
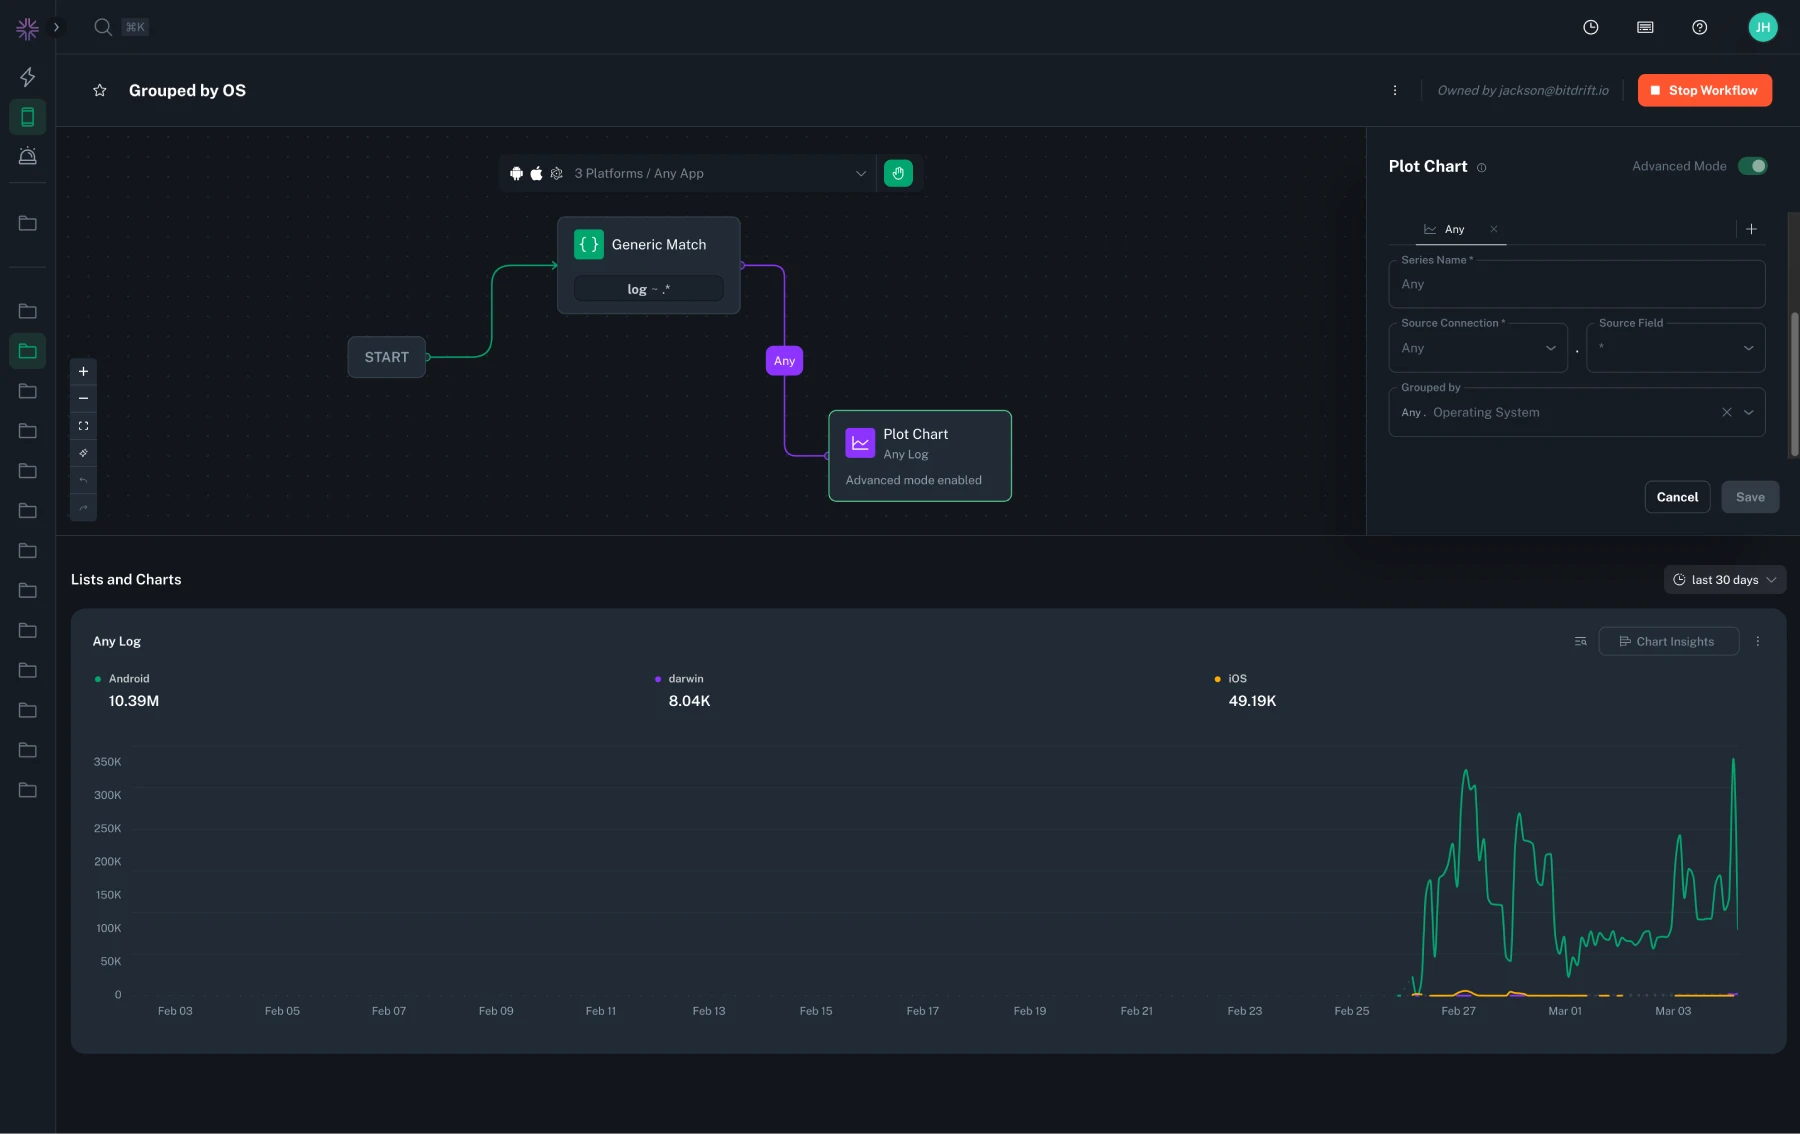
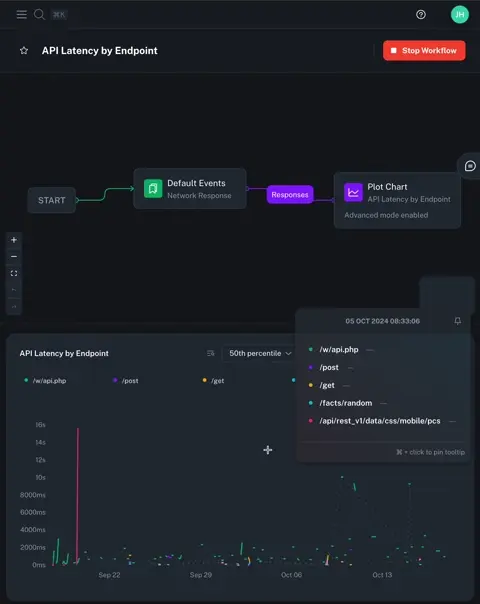
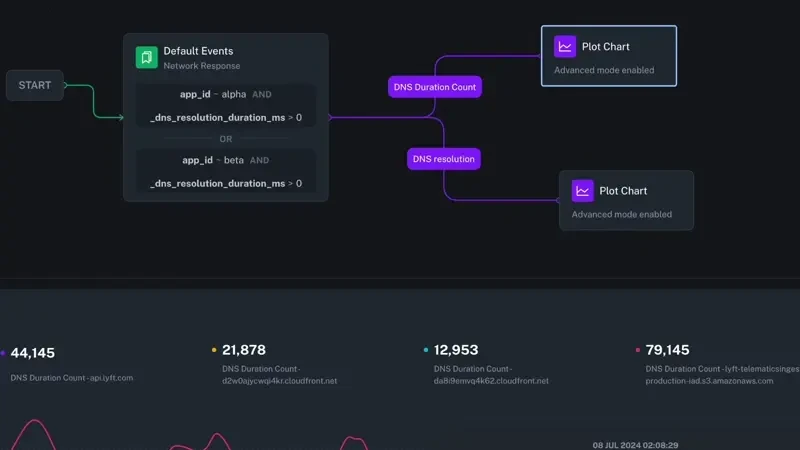
We've released advanced mode for workflow Plot Chart actions! You can now create sums and group bys via log field extraction, rates (like network success rate), and fleet-wide accurate histograms of metrics like P90 request latency grouped by fields such as URL endpoint!
Fixed a bug where workflows with multiple chart outputs would experience strange behavior when changing the selected date/time range.
Fixed a bug where deleting a workflow would not automatically navigate to the next available workflow in the exploration.
We're now capturing metadata for every Record Session action in your workflows. When viewing list insights you can now filter the session table by any of the metadata dimensions we collect, as well as for a specific time frame. In addition to this, we'll now automatically emit a metric for every captured session, so you can track captures at a high level.
Fixed an intermittent bug where a timeline session wouldn't fully load.
There's now an option in the node context menu to duplicate a node, allowing you to quickly copy/paste a single node without using the keyboard shortcuts.
Our brand new feature, Aggregated Insights, is now available!
Insights provides detailed visualizations and breakdowns of what's happening in your mobile fleet. Included as part of every workflow, bitdrift captures detailed metadata about the attributes of the users and their devices.
Capture metadata for every workflow with a Plot Chart action (insights for Record Session coming soon).
Apply Filters to narrow down results.
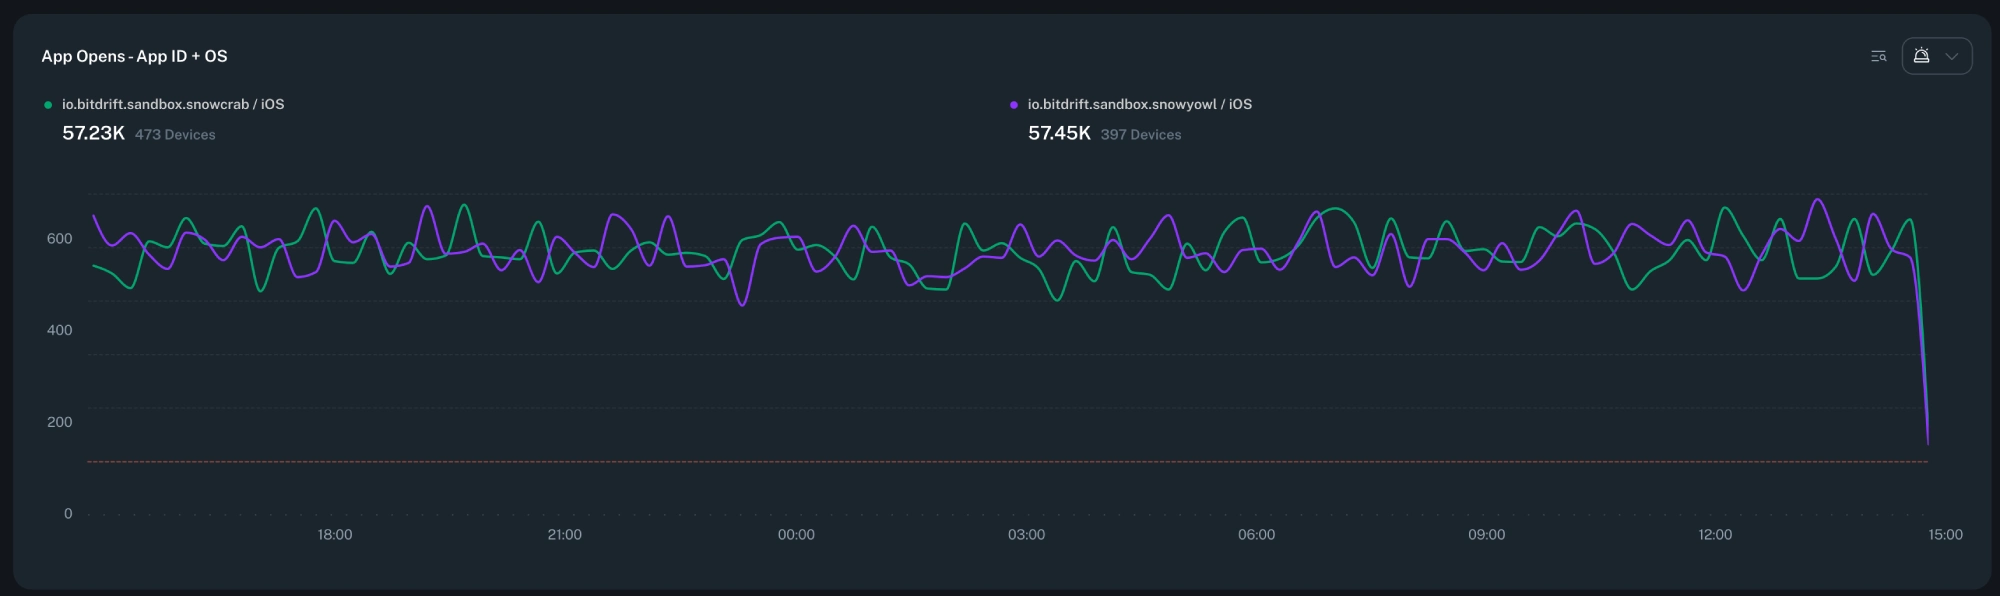
Compare multiple series of a Plot Chart action to easily spot outliers.
We updated our side rail to only show your owned and favorited explorations to accompany the updates we made to the explorations home page. We will also remember the expanded state of the side rail through refreshes.
We've supercharged your workflow toolkit with powerful new features designed for flexibility and ease of use.
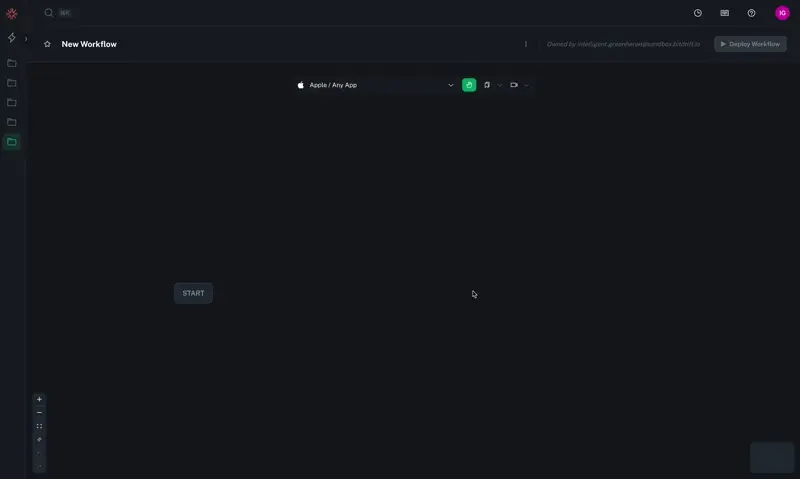
🔀 Multiple paths: Introducing the capability to create workflows with independent paths. This is a game-changer for comparing different user journeys or identifying correlations within charts. To facilitate this, we've implemented a "Start" node as the initial point for all active paths.
📈 Multiple Charts: You can now generate multiple charts from your workflows, with each "Plot Chart" action resulting in a new chart. Multi-series charts remain available by linking different journeys into the same "Plot Chart" action.
🔁 Loops: Loops are now supported within workflows, ideal for scenarios such as plotting the number of errors encountered after a user is exposed to an experiment. This feature provides deeper insights into specific journeys and more robust workflow capabilities.
✨ Brand New UX: We redesigned the user experience keeping it familiar and yet more intuitive and efficient. The new UX focuses on simplicity and flexibility, empowering you to create workflows with minimal effort.

Added support for JSON fields in the expanded log details panel. Now fields containing valid JSON will be displayed in a collapsible tree view.
We added a new starting tab to the Explorations home page so you can easily see and sort through your available workflows. You can now easily see which workflows you have deployed, mark workflows as favorites, filter by active, owned, unowned, and favorited workflows, and see how many connected devices your tenant currently has.
Fixed a bug where the minimap scrubber would not update its position when zooming in/out.
We achieved SOC 2 compliance! This means that our platform meets the highest standards for security, availability, confidentiality, and privacy of customer data. See the announcement here.
Fixed a bug where navigating between workflows would result in expanded explorations being collapsed, and scroll position being lost.
Fixed a bug where workflows could not be renamed.
Fixed a bug where screens in the Session Replay panel would appear out of order when navigating the timeline.
Fixed several bugs which contributed to nodes moving or disappearing from the workflow editor when editing a node via a modal, or when deploying a workflow in a pending state.
We've increased the lookback period for charts to 30 days. Now you can analyze your data over a longer period of time.
We've added a new sandbox environment so that you can try out Capture without any setup.
We've completely redesigned our Explorations home page. It now features helpful resources to streamline your onboarding experience and boost your progress.
Explore the basics of the Capture platform with guided tours. Launch them anytime from the new Explorations home page.
Product Changelog now publicly available. Keep up to date with all the bitdrift changes and improvements in this feed.
We've added a few new commands to help you navigate the app more easily.
Released companion libraries to automatically forward logs to Capture when using existing 3rd party logging libraries: Timber on Android / CocoaLumberjack, and SwiftyBeaver on iOS. Head over to our docs for instructions on how to integrate them into your apps.